
Page 160 - Demo
P. 160
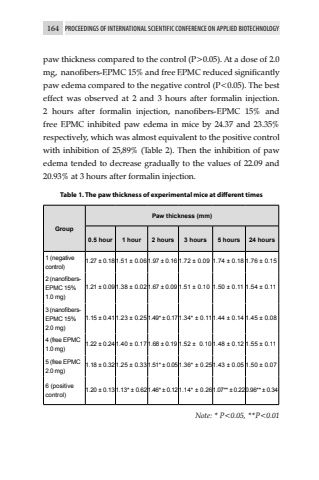
164 PROCEEDINGS OF INTERNATIONAL SCIENTIFIC CONFERENCE ON APPLIED BIOTECHNOLOGYpaw thickness compared to the control (P>0.05). At a dose of 2.0 mg, nanofibers-EPMC 15% and free EPMC reduced significantly paw edema compared to the negative control (P<0.05). The best effect was observed at 2 and 3 hours after formalin injection. 2 hours after formalin injection, nanofibers-EPMC 15% and free EPMC inhibited paw edema in mice by 24.37 and 23.35% respectively, which was almost equivalent to the positive control with inhibition of 25,89% (Table 2). Then the inhibition of paw edema tended to decrease gradually to the values of 22.09 and 20.93% at 3 hours after formalin injection. Table 1. The paw thickness of experimental mice at different timesGroupPaw thickness (mm)0.5 hour 1 hour 2 hours 3 hours 5 hours 24 hours1 (negative control)1.27 %u00b1 0.181.51 %u00b1 0.06 1.97 %u00b1 0.16 1.72 %u00b1 0.09 1.74 %u00b1 0.18 1.76 %u00b1 0.152 (nanofibersEPMC 15% 1.0 mg)1.21 %u00b1 0.091.38 %u00b1 0.02 1.67 %u00b1 0.09 1.51 %u00b1 0.10 1.50 %u00b1 0.11 1.54 %u00b1 0.113 (nanofibersEPMC 15% 2.0 mg)1.15 %u00b1 0.411.23 %u00b1 0.25 1.49* %u00b1 0.171.34* %u00b1 0.11 1.44 %u00b1 0.14 1.45 %u00b1 0.084 (free EPMC 1.0 mg)1.22 %u00b1 0.241.40 %u00b1 0.17 1.68 %u00b1 0.19 1.52 %u00b1 0.10 1.48 %u00b1 0.12 1.55 %u00b1 0.115 (free EPMC 2.0 mg)1.18 %u00b1 0.321.25 %u00b1 0.33 1.51* %u00b1 0.051.36* %u00b1 0.251.43 %u00b1 0.05 1.50 %u00b1 0.076 (positive control)1.20 %u00b1 0.131.13* %u00b1 0.621.46* %u00b1 0.121.14* %u00b1 0.261.07** %u00b1 0.220.96** %u00b1 0.34Note: * P<0.05, **P<0.01
