
Page 490 - Ebook HTKH 2024
P. 490
Qualitative analysis: The author conducted interviews with six business owners
from the craft villages in Hung Yen Province. The questions aimed to explore which
variables influence green growth and which factors they consider the most important.
The objective was to determine whether they would add or remove any of the initial
factors proposed by the author. The results showed that they agreed with the variables
suggested by the author and did not propose any additional factors. After the discussion,
the author retained the five initial independent variables and proceeded with a larger-
scale survey.
Quantitative analysis: After collecting the survey data, the author used SPSS 22
to perform descriptive statistics, conduct Cronbach’s Alpha analysis, Exploratory Factor
Analysis (EFA), correlation analysis, and regression analysis.
The Cronbach’s Alpha coefficient is a tool for determining which observed
variables are suitable for inclusion in a factor group. It also reflects the degree of
correlation between the observed variables within the same factor and measures the
contribution of each factor (Cronbach, 1951).
Exploratory Factor Analysis (EFA) is the process of replacing a group of initial
variables that are correlated with each other with a smaller set of new variables, which
are linear combinations of them. To perform factor analysis, the KMO coefficient must
satisfy the criterion 0.5 ≤ KMO ≤ 1, and Bartlett's test must be statistically significant
(Sig. < 0.05).
4. Results
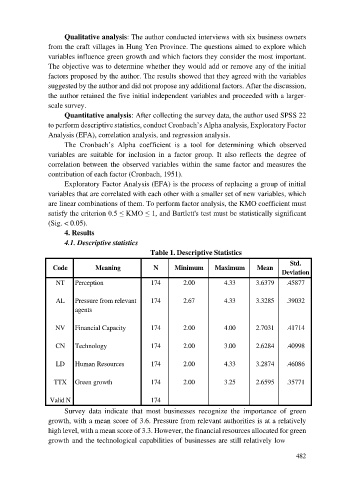
4.1. Descriptive statistics
Table 1. Descriptive Statistics
Std.
Code Meaning N Minimum Maximum Mean
Deviation
NT Perception 174 2.00 4.33 3.6379 .45877
AL Pressure from relevant 174 2.67 4.33 3.3285 .39032
agents
NV Financial Capacity 174 2.00 4.00 2.7031 .41714
CN Technology 174 2.00 3.00 2.6284 .40998
LD Human Resources 174 2.00 4.33 3.2874 .46086
TTX Green growth 174 2.00 3.25 2.6595 .35771
Valid N 174
Survey data indicate that most businesses recognize the importance of green
growth, with a mean score of 3.6. Pressure from relevant authorities is at a relatively
high level, with a mean score of 3.3. However, the financial resources allocated for green
growth and the technological capabilities of businesses are still relatively low
482