Page 494 - Ebook HTKH 2024
P. 494

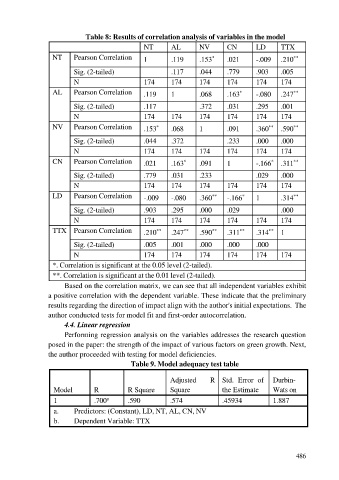
Table 8: Results of correlation analysis of variables in the model
                                                    NT       AL        NV        CN        LD       TTX

                    NT     Pearson Correlation      1        .119      .153      .021      -.009    .210
                                                                            *
                                                                                                        **
                           Sig. (2-tailed)                   .117      .044      .779      .903     .005
                           N                        174      174       174       174       174      174
                    AL     Pearson Correlation      .119     1         .068      .163      -.080    .247
                                                                                     *
                                                                                                        **
                           Sig. (2-tailed)          .117               .372      .031      .295     .001

                           N                        174      174       174       174       174      174
                    NV     Pearson Correlation      .153     .068      1         .091      .360   .590
                                                        *
                                                                                                        **
                                                                                                **
                           Sig. (2-tailed)          .044     .372                .233      .000     .000
                           N                        174      174       174       174       174      174
                    CN     Pearson Correlation      .021     .163      .091      1         -.166   .311
                                                                  *
                                                                                                        **
                                                                                                *
                           Sig. (2-tailed)          .779     .031      .233                .029     .000
                           N                        174      174       174       174       174      174
                    LD     Pearson Correlation      -.009    -.080     .360      -.166     1        .314
                                                                                                        **
                                                                                      *
                                                                            **
                           Sig. (2-tailed)          .903     .295      .000      .029               .000
                           N                        174      174       174       174       174      174

                    TTX  Pearson Correlation        .210     .247      .590      .311      .314   1
                                                        **
                                                                                                **
                                                                                     **
                                                                  **
                                                                            **
                           Sig. (2-tailed)          .005     .001      .000      .000      .000
                           N                        174      174       174       174       174      174
                    *. Correlation is significant at the 0.05 level (2-tailed).
                    **. Correlation is significant at the 0.01 level (2-tailed).
                        Based on the correlation matrix, we can see that all independent variables exhibit
                  a positive correlation with the dependent variable. These indicate that the preliminary
                  results regarding the direction of impact align with the author's initial expectations. The
                  author conducted tests for model fit and first-order autocorrelation.
                        4.4. Linear regression
                        Performing regression analysis on the variables addresses the research question

                  posed in the paper: the strength of the impact of various factors on green growth. Next,
                  the author proceeded with testing for model deficiencies.
                                               Table 9. Model adequacy test table


                                                             Adjusted      R  Std.  Error  of  Durbin-
                    Model         R           R Square       Square            the Estimate      Wats on

                    1             .700        .590           .574              .45934            1.887
                                       a
                    a.     Predictors: (Constant), LD, NT, AL, CN, NV
                    b.     Dependent Variable: TTX


                                                                                                         486
   489   490   491   492   493   494   495   496   497   498   499