Page 491 - Ebook HTKH 2024
P. 491

and do not meet the requirements for green growth, with a mean score of 2.7. Although
                  the labor force is readily available and eager to learn, its quality remains suboptimal,

                  with a mean score of 3.2, resulting in a low level of achievement in green growth among
                  these establishments (mean score of 2.7).
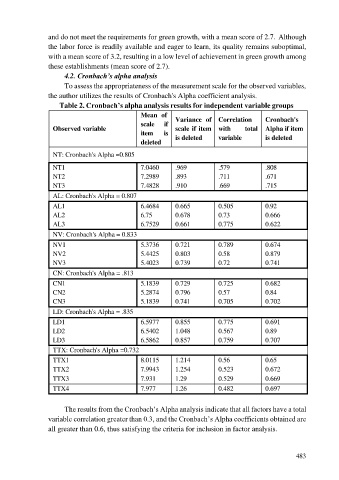
                        4.2. Cronbach’s alpha analysis
                        To assess the appropriateness of the measurement scale for the observed variables,
                  the author utilizes the results of Cronbach's Alpha coefficient analysis.
                      Table 2. Cronbach’s alpha analysis results for independent variable groups
                                                   Mean  of
                                                   scale   if   Variance  of  Correlation     Cronbach's
                    Observed variable                          scale if item  with     total  Alpha if item
                                                   item    is   is deleted    variable        is deleted
                                                   deleted

                    NT: Cronbach's Alpha =0.805

                    NT1                           7.0460       .969           .579            .808
                    NT2                           7.2989       .893           .711            .671
                    NT3                           7.4828       .910           .669            .715
                    AL: Cronbach's Alpha = 0.807
                    AL1                           6.4684       0.665          0.505           0.92
                    AL2                           6.75         0.678          0.73            0.666
                    AL3                           6.7529       0.661          0.775           0.622
                    NV: Cronbach's Alpha = 0.833

                    NV1                           5.3736       0.721          0.789           0.674
                    NV2                           5.4425       0.803          0.58            0.879
                    NV3                           5.4023       0.739          0.72            0.741
                    CN: Cronbach's Alpha = .813
                    CN1                           5.1839       0.729          0.725           0.682
                    CN2                           5.2874       0.796          0.57            0.84
                    CN3                           5.1839       0.741          0.705           0.702

                    LD: Cronbach's Alpha = .835
                    LD1                           6.5977       0.855          0.775           0.691
                    LD2                           6.5402       1.048          0.567           0.89
                    LD3                           6.5862       0.857          0.759           0.707
                    TTX: Cronbach's Alpha =0.732
                    TTX1                          8.0115       1.214          0.56            0.65
                    TTX2                          7.9943       1.254          0.523           0.672
                    TTX3                          7.931        1.29           0.529           0.669
                    TTX4                          7.977        1.26           0.482           0.697


                        The results from the Cronbach’s Alpha analysis indicate that all factors have a total
                  variable correlation greater than 0.3, and the Cronbach’s Alpha coefficients obtained are
                  all greater than 0.6, thus satisfying the criteria for inclusion in factor analysis.


                                                                                                         483
   486   487   488   489   490   491   492   493   494   495   496