Page 493 - Ebook HTKH 2024
P. 493

For the dependent variable, 4 variables converge into a representative variable that
                  characterizes the level of green growth of the enterprise. The specific factor  groups are

                  identified through the rotated matrix table.
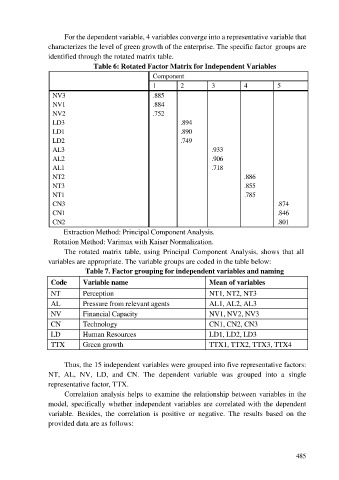
                                  Table 6: Rotated Factor Matrix for Independent Variables
                                                       Component
                                                       1         2         3           4           5
                    NV3                                .885
                    NV1                                .884
                    NV2                                .752
                    LD3                                          .894
                    LD1                                          .890
                    LD2                                          .749
                    AL3                                                    .933
                    AL2                                                    .906
                    AL1                                                    .718
                    NT2                                                                .886
                    NT3                                                                .855
                    NT1                                                                .785
                    CN3                                                                            .874
                    CN1                                                                            .846
                    CN2                                                                            .801
                       Extraction Method: Principal Component Analysis.
                    Rotation Method: Varimax with Kaiser Normalization.
                        The  rotated  matrix  table,  using  Principal  Component  Analysis,  shows  that  all
                  variables are appropriate. The variable groups are coded in the table below:
                               Table 7. Factor grouping for independent variables and naming

                   Code       Variable name                                Mean of variables
                   NT         Perception                                   NT1, NT2, NT3

                   AL         Pressure from relevant agents                AL1, AL2, AL3
                   NV         Financial Capacity                           NV1, NV2, NV3
                   CN         Technology                                   CN1, CN2, CN3
                   LD         Human Resources                              LD1, LD2, LD3

                   TTX        Green growth                                 TTX1, TTX2, TTX3, TTX4

                        Thus, the 15 independent variables were grouped into five representative factors:
                  NT,  AL,  NV,  LD,  and  CN.  The  dependent  variable  was  grouped  into  a  single
                  representative factor, TTX.

                        Correlation analysis helps to examine the relationship between variables in the
                  model, specifically whether independent variables are correlated with the dependent
                  variable.  Besides,  the  correlation  is  positive  or  negative.  The  results  based  on  the
                  provided data are as follows:


                                                                                                         485
   488   489   490   491   492   493   494   495   496   497   498