
Page 492 - Ebook HTKH 2024
P. 492
4.3. Exploratory factor analysis (EFA)
Factor analysis can only be implemented when the obtained data must ensure that
the KMO coefficient falls within the range of [0.5; 1] and that Bartlett’s test is
statistically significant.
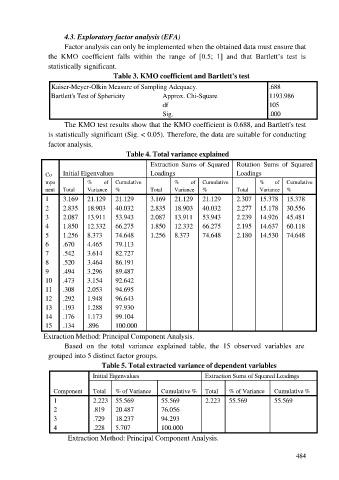
Table 3. KMO coefficient and Bartlett's test
Kaiser-Meyer-Olkin Measure of Sampling Adequacy. .688
Bartlett's Test of Sphericity Approx. Chi-Square 1193.986
df 105
Sig. .000
The KMO test results show that the KMO coefficient is 0.688, and Bartlett's test
is statistically significant (Sig. < 0.05). Therefore, the data are suitable for conducting
factor analysis.
Table 4. Total variance explained
Extraction Sums of Squared Rotation Sums of Squared
Co Initial Eigenvalues Loadings Loadings
mpo % of Cumulative % of Cumulative % of Cumulative
nent Total Variance % Total Variance % Total Variance %
1 3.169 21.129 21.129 3.169 21.129 21.129 2.307 15.378 15.378
2 2.835 18.903 40.032 2.835 18.903 40.032 2.277 15.178 30.556
3 2.087 13.911 53.943 2.087 13.911 53.943 2.239 14.926 45.481
4 1.850 12.332 66.275 1.850 12.332 66.275 2.195 14.637 60.118
5 1.256 8.373 74.648 1.256 8.373 74.648 2.180 14.530 74.648
6 .670 4.465 79.113
7 .542 3.614 82.727
8 .520 3.464 86.191
9 .494 3.296 89.487
10 .473 3.154 92.642
11 .308 2.053 94.695
12 .292 1.948 96.643
13 .193 1.288 97.930
14 .176 1.173 99.104
15 .134 .896 100.000
Extraction Method: Principal Component Analysis.
Based on the total variance explained table, the 15 observed variables are
grouped into 5 distinct factor groups.
Table 5. Total extracted variance of dependent variables
Initial Eigenvalues Extraction Sums of Squared Loadings
Component Total % of Variance Cumulative % Total % of Variance Cumulative %
1 2.223 55.569 55.569 2.223 55.569 55.569
2 .819 20.487 76.056
3 .729 18.237 94.293
4 .228 5.707 100.000
Extraction Method: Principal Component Analysis.
484