


Page 36 - ISC PROCEEDINGS 21.4
P. 36
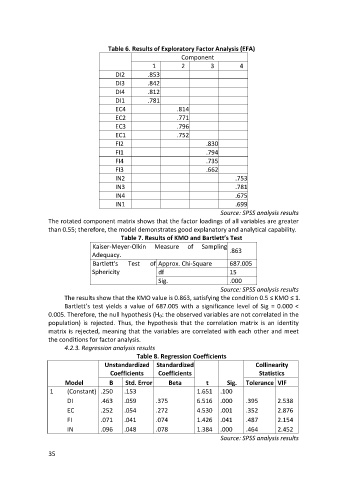
Table 6. Results of Exploratory Factor Analysis (EFA)
                                                                 Component
                                                       1         2         3         4
                                          DI2        .853
                                          DI3        .842
                                          DI4        .812
                                          DI1        .781
                                          EC4                  .814
                                          EC2                  .771
                                          EC3                  .796
                                          EC1                  .752
                                          FI2                            .830
                                          FI1                            .794
                                          FI4                            .735
                                          FI3                            .662
                                          IN2                                       .753
                                          IN3                                       .781
                                          IN4                                       .675
                                          IN1                                       .699
                                                                              Source: SPSS analysis results
                  The rotated component matrix shows that the factor loadings of all variables are greater
                  than 0.55; therefore, the model demonstrates good explanatory and analytical capability.
                                            Table 7. Results of KMO and Bartlett’s Test
                                  Kaiser-Meyer-Olkin   Measure     of   Sampling
                                 Adequacy.                                        .863
                                  Bartlett's  Test    of Approx. Chi-Square       687.005
                                 Sphericity              df                       15
                                                         Sig.                     .000
                                                                              Source: SPSS analysis results
                        The results show that the KMO value is 0.863, satisfying the condition 0.5 ≤ KMO ≤ 1.
                        Bartlett’s test yields a value of 687.005 with a significance level of Sig = 0.000 <
                  0.005. Therefore, the null hypothesis (H₀: the observed variables are not correlated in the
                  population) is rejected. Thus, the hypothesis that the correlation matrix is an identity
                  matrix is rejected, meaning that the variables are correlated with each other and meet
                  the conditions for factor analysis.
                        4.2.3. Regression analysis results
                                                 Table 8. Regression Coefficients
                                      Unstandardized    Standardized                       Collinearity
                                        Coefficients     Coefficients                       Statistics
                        Model          B     Std. Error     Beta         t       Sig.  Tolerance VIF
                   1     (Constant) .250     .153                     1.651   .100
                         DI         .463     .059       .375          6.516   .000     .395        2.538
                         EC         .252     .054       .272          4.530   .001     .352        2.876
                         FI         .071     .041       .074          1.426   .041     .487        2.154
                         IN         .096     .048       .078          1.384   .000     .464        2.452
                                                                              Source: SPSS analysis results

                  35

