
Page 380 - Demo
P. 380
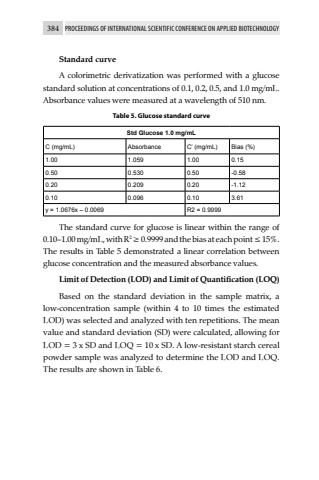
384 PROCEEDINGS OF INTERNATIONAL SCIENTIFIC CONFERENCE ON APPLIED BIOTECHNOLOGYStandard curveA colorimetric derivatization was performed with a glucose standard solution at concentrations of 0.1, 0.2, 0.5, and 1.0 mg/mL. Absorbance values were measured at a wavelength of 510 nm.Table 5. Glucose standard curveStd Glucose 1.0 mg/mLC (mg/mL) Absorbance C%u2019 (mg/mL) Bias (%)1.00 1.059 1.00 0.150.50 0.530 0.50 -0.580.20 0.209 0.20 -1.120.10 0.096 0.10 3.61y = 1.0676x %u2013 0.0069 R2 = 0.9999The standard curve for glucose is linear within the range of 0.10%u20131.00 mg/mL, with R2 %u2265 0.9999 and the bias at each point %u2264 15%. The results in Table 5 demonstrated a linear correlation between glucose concentration and the measured absorbance values.Limit of Detection (LOD) and Limit of Quantification (LOQ)Based on the standard deviation in the sample matrix, a low-concentration sample (within 4 to 10 times the estimated LOD) was selected and analyzed with ten repetitions. The mean value and standard deviation (SD) were calculated, allowing for LOD = 3 x SD and LOQ = 10 x SD. A low-resistant starch cereal powder sample was analyzed to determine the LOD and LOQ. The results are shown in Table 6.
