
Page 527 - Ebook HTKH 2024
P. 527
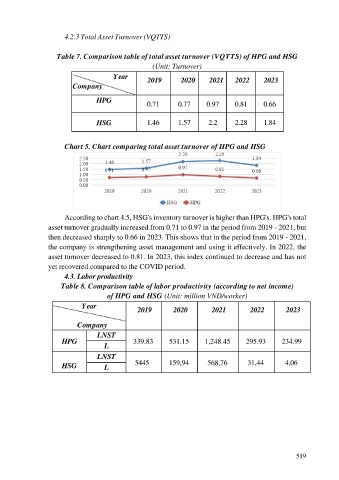
4.2.3 Total Asset Turnover (VQTTS)


                     Table 7. Comparison table of total asset turnover (VQTTS) of HPG and HSG
                                                       (Unit: Turnover)
                                         Year        2019        2020      2021     2022      2023
                           Company

                                   HPG
                                                     0.71       0.77      0.97      0.81      0.66


                                   HSG               1.46       1.57      2.2       2.28      1.84


                        Chart 5. Chart comparing total asset turnover of HPG and HSG


                        According to chart 4.5, HSG's inventory turnover is higher than HPG's. HPG's total
                  asset turnover gradually increased from 0.71 to 0.97 in the period from 2019 - 2021, but
                  then decreased sharply to 0.66 in 2023. This shows that in the period from 2019 - 2021,
                  the company is strengthening asset management and using it effectively. In 2022, the
                  asset turnover decreased to 0.81. In 2023, this index continued to decrease and has not

                  yet recovered compared to the COVID period.
                        4.3. Labor productivity
                      Table 8. Comparison table of labor productivity (according to net income)
                                       of HPG and HSG (Unit: million VND/worker)
                              Year               2019         2020         2021          2022         2023

                            Company

                                   LNST
                       HPG                      339.83      531.15       1,248.45      295.93       234.99
                                      L
                                   LNST
                       HSG            L         5445        159,94        568,76        31,44        4,06


                                                                                                         519