
Page 523 - Ebook HTKH 2024
P. 523
Compare the fluctuations of indicators from the following year to the previous
year; compare the corresponding indicators of Hoa Phat Steel Group Joint Stock
Company (HPG) with Hoa Sen Steel Group Joint Stock Company (HSG)
Analysis and synthesis method
Based on the results of statistics and comparison of economic indicators of HPG
and HSG, the article uses analysis and synthetic methods to evaluate the positive aspects,
limitations, shortcomings, and causes of limitations and shortcomings in HPG's business
performance.
Research tools
Data: Secondary data, based on reports, business performance reports, balance
sheets of HPG and HSG.
Tools: Tables, charts, graphs, diagrams, mathematical statistics (Trend function),
Excel software
4. Results and discussion
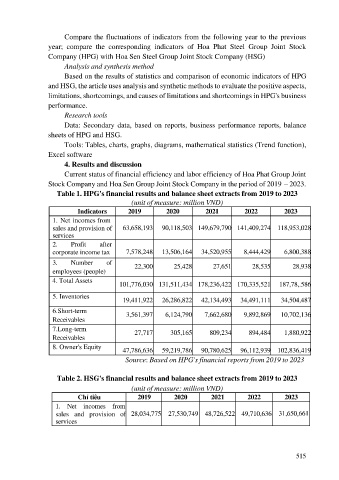
Current status of financial efficiency and labor efficiency of Hoa Phat Group Joint
Stock Company and Hoa Sen Group Joint Stock Company in the period of 2019 – 2023.
Table 1. HPG's financial results and balance sheet extracts from 2019 to 2023
(unit of measure: million VND)
Indicators 2019 2020 2021 2022 2023
1. Net incomes from
sales and provision of 63,658,193 90,118,503 149,679,790 141,409,274 118,953,028
services
2. Profit after
corporate income tax 7,578,248 13,506,164 34,520,955 8,444,429 6,800,388
3. Number of 22,300 25,428 27,651 28,535 28,938
employees (people)
4. Total Assets
101,776,030 131,511,434 178,236,422 170,335,521 187,78,.586
5. Inventories
19,411,922 26,286,822 42,134,493 34,491,111 34,504,487
6.Short-term 3,561,397 6,124,790 7,662,680 9,892,869 10,702,136
Receivables
7.Long-term 27,717 305,165 809,234 894,484 1,880,922
Receivables
8. Owner's Equity
47,786,636 59,219,786 90,780,625 96,112,939 102,836,419
Source: Based on HPG's financial reports from 2019 to 2023
Table 2. HSG's financial results and balance sheet extracts from 2019 to 2023
(unit of measure: million VND)
Chỉ tiêu 2019 2020 2021 2022 2023
1. Net incomes from
sales and provision of 28,034,775 27,530,749 48,726,522 49,710,636 31,650,661
services
515