
Page 525 - Ebook HTKH 2024
P. 525
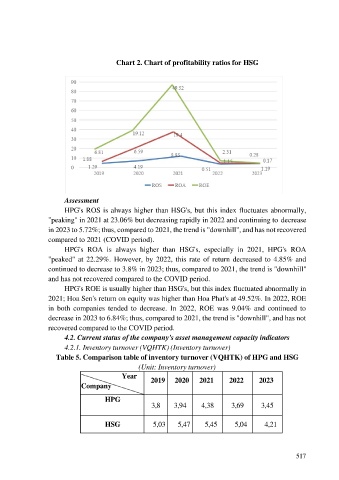
Chart 2. Chart of profitability ratios for HSG


                        Assessment
                        HPG's ROS is always higher than HSG's, but this index fluctuates abnormally,
                  "peaking" in 2021 at 23.06% but decreasing rapidly in 2022 and continuing to decrease

                  in 2023 to 5.72%; thus, compared to 2021, the trend is "downhill", and has not recovered
                  compared to 2021 (COVID period).
                        HPG's  ROA  is  always  higher  than  HSG's,  especially  in  2021,  HPG's  ROA
                  "peaked" at 22.29%.  However, by 2022, this rate of return decreased to 4.85% and
                  continued to decrease to 3.8% in 2023; thus, compared to 2021, the trend is "downhill"
                  and has not recovered compared to the COVID period.
                        HPG's ROE is usually higher than HSG's, but this index fluctuated abnormally in
                  2021; Hoa Sen's return on equity was higher than Hoa Phat's at 49.52%. In 2022, ROE

                  in  both  companies  tended  to  decrease.  In  2022,  ROE  was  9.04%  and  continued  to
                  decrease in 2023 to 6.84%; thus, compared to 2021, the trend is "downhill", and has not
                  recovered compared to the COVID period.
                        4.2. Current status of the company's asset management capacity indicators
                        4.2.1. Inventory turnover (VQHTK) (Inventory turnover)
                     Table 5. Comparison table of inventory turnover (VQHTK) of HPG and HSG

                                                  (Unit: Inventory turnover)
                                            Year      2019    2020     2021       2022      2023
                              Company

                                      HPG
                                                      3,8     3,94      4,38      3,69       3,45


                                      HSG              5,03     5,47     5,45       5,04      4,21


                                                                                                         517