
Page 524 - Ebook HTKH 2024
P. 524
2. Profit after corporate
income tax 361,372 1153,014 4,313,494 251,320 30,062
3. Number of employees 6,637 7,209 7,584 7,994 7,402
(people)
4. Total Assets 17,225,438 17,756,407 26,618,030 17,025,411 17,365,305
5. Inventories 4,547,528 5,523,844 12,349,095 7,395,309 7,628,606
6.Short-term Receivables 1,339,263 2,024,273 4,534,902 1,452,105 2,322,150
7.Long-term Receivables 226,761 184,949 179,887 171,495 143,083
8. Owner's Equity 5,468,281 6,590,738 10,831,793 10,883,569 10,780,166
Source: Based on HSG's financial reports from 2019 to 2023
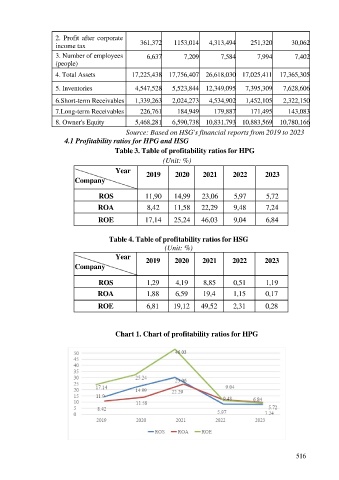
4.1 Profitability ratios for HPG and HSG
Table 3. Table of profitability ratios for HPG
(Unit: %)
Year 2019 2020 2021 2022 2023
Company
ROS 11,90 14,99 23,06 5,97 5,72
ROA 8,42 11,58 22,29 9,48 7,24
ROE 17,14 25,24 46,03 9,04 6,84
Table 4. Table of profitability ratios for HSG
(Unit: %)
Year 2019 2020 2021 2022 2023
Company
ROS 1,29 4,19 8,85 0,51 1,19
ROA 1,88 6,59 19,4 1,15 0,17
ROE 6,81 19,12 49,52 2,31 0,28
Chart 1. Chart of profitability ratios for HPG
516