
Page 526 - Ebook HTKH 2024
P. 526
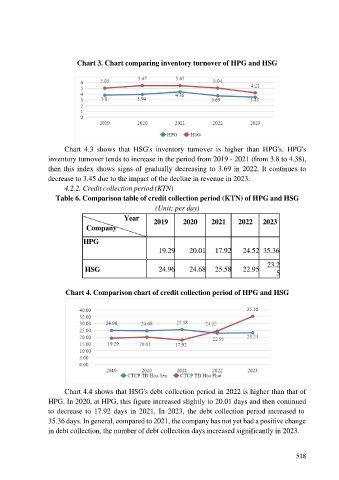
Chart 3. Chart comparing inventory turnover of HPG and HSG


                        Chart  4.3  shows  that  HSG's  inventory  turnover  is  higher  than  HPG's.  HPG's
                  inventory turnover tends to increase in the period from 2019 - 2021 (from 3.8 to 4.38),
                  then this index shows signs of gradually decreasing to 3.69 in 2022. It continues to
                  decrease to 3.45 due to the impact of the decline in revenue in 2023.
                        4.2.2. Credit collection period (KTN)
                     Table 6. Comparison table of credit collection period (KTN) of HPG and HSG

                                                        (Unit: per day)
                                             Year      2019      2020      2021      2022    2023
                               Company

                              HPG
                                                         19.29      20.01    17.92    24.52  35.36

                                                                                               23.2
                               HSG                       24.96      24.68    25.58    22.95
                                                                                                  5

                        Chart 4. Comparison chart of credit collection period of HPG and HSG


                        Chart 4.4 shows that HSG's debt collection period in 2022 is higher than that of
                  HPG. In 2020, at HPG, this figure increased slightly to 20.01 days and then continued
                  to  decrease  to  17.92  days  in  2021.  In  2023,  the  debt collection period increased to
                  35.36 days. In general, compared to 2021, the company has not yet had a positive change

                  in debt collection, the number of debt collection days increased significantly in 2023.


                                                                                                         518