
Page 410 - Ebook HTKH 2024
P. 410
The results in Table 1 show that, in a total of 165 surveys, consumers'
understanding of the need to protect the environment and green industrial products is
mainly at a high level of about 4 - 5 (questions II.1-II.3). That means they have a good
understanding of the green environment and green industrial products.
The results in Table 1, in a total of 165 surveys to determine consumers' needs for
purchasing and using green industrial products (questions II.4-II.9) show that they all
support, intend and want to consume green industrial products, but they are not sure that
they will replace the industrial products they are using with green industrial products
(question II.7) and so do their friends (question II.9).
The results in Table 1, out of a total of 165 surveys to determine consumers' ability
to use green credit to purchase and use green industrial products (from question II.10 to
question II.15), show that the majority of consumers believe that green industrial
products will have high prices (mean = 4.55); most of them believe that if they use
green credit services for green industrial product consumption from banks, the amount
of interest they have to pay periodically will be higher (mean = 4.539). Therefore, in the
coming time, they will limit the use of consumer credit services from banks to purchase
green industrial products (mean = 2.92) because they do not understand much about
consumer credit products and green credit from banks (2.715<mean<3).
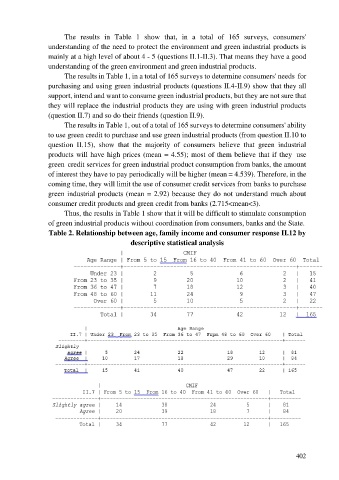
Thus, the results in Table 1 show that it will be difficult to stimulate consumption
of green industrial products without coordination from consumers, banks and the State.
Table 2. Relationship between age, family income and consumer response II.12 by
descriptive statistical analysis
402