
Page 780 - ISC PROCEEDINGS 21.4
P. 780
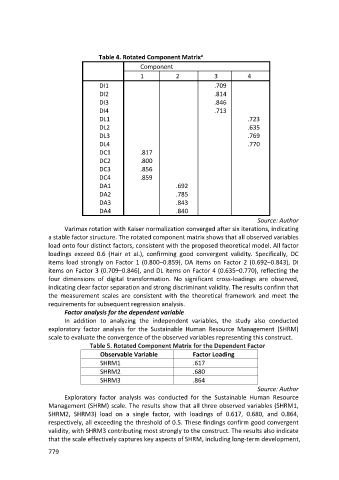
Table 4. Rotated Component Matrix   a
                                                  Component
                                                  1            2            3           4
                                    DI1                                     .709
                                    DI2                                     .814
                                    DI3                                     .846
                                    DI4                                     .713
                                    DL1                                                 .723
                                    DL2                                                 .635
                                    DL3                                                 .769
                                    DL4                                                 .770
                                    DC1           .817
                                    DC2           .800
                                    DC3           .856
                                    DC4           .859
                                    DA1                        .692
                                    DA2                        .785
                                    DA3                        .843
                                    DA4                        .840
                                                                                           Source: Author
                        Varimax rotation with Kaiser normalization converged after six iterations, indicating
                  a stable factor structure. The rotated component matrix shows that all observed variables
                  load onto four distinct factors, consistent with the proposed theoretical model. All factor
                  loadings exceed 0.6 (Hair et al.), confirming good convergent validity. Specifically, DC
                  items load strongly on Factor 1 (0.800–0.859), DA items on Factor 2 (0.692–0.843), DI
                  items on Factor 3 (0.709–0.846), and DL items on Factor 4 (0.635–0.770), reflecting the
                  four dimensions of digital transformation. No significant cross-loadings are observed,
                  indicating clear factor separation and strong discriminant validity. The results confirm that
                  the measurement scales are consistent with the theoretical framework and meet the
                  requirements for subsequent regression analysis.
                        Factor analysis for the dependent variable
                        In addition to analyzing the independent variables, the study also conducted
                  exploratory factor analysis for the Sustainable Human Resource Management (SHRM)
                  scale to evaluate the convergence of the observed variables representing this construct.
                                 Table 5. Rotated Component Matrix for the Dependent Factor
                                    Observable Variable              Factor Loading
                                    SHRM1                            .617
                                    SHRM2                            .680
                                    SHRM3                            .864
                                                                                           Source: Author
                        Exploratory factor analysis was conducted for the Sustainable Human Resource
                  Management (SHRM) scale. The results show that all three observed variables (SHRM1,
                  SHRM2, SHRM3) load on a single factor, with loadings of 0.617, 0.680, and 0.864,
                  respectively, all exceeding the threshold of 0.5. These findings confirm good convergent
                  validity, with SHRM3 contributing most strongly to the construct. The results also indicate
                  that the scale effectively captures key aspects of SHRM, including long-term development,

                  779