
Page 778 - ISC PROCEEDINGS 21.4
P. 778
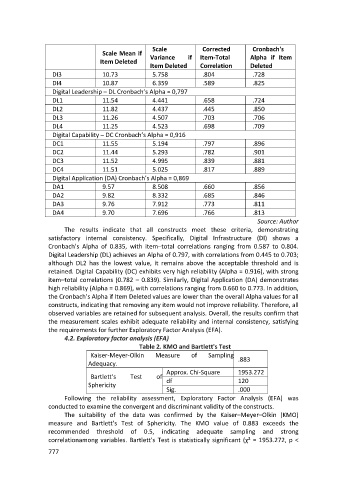
Scale            Corrected         Cronbach's
                                     Scale Mean if
                                    Item Deleted      Variance     if  Item-Total        Alpha if Item
                                                      Item Deleted     Correlation       Deleted
                   DI3               10.73             5.758            .804              .728
                   DI4               10.87             6.359            .589              .825
                   Digital Leadership – DL Cronbach’s Alpha = 0,797
                   DL1               11.54             4.441            .658              .724
                   DL2               11.82             4.437            .445              .850
                   DL3               11.26             4.507            .703              .706
                   DL4               11.25             4.523            .698              .709
                   Digital Capability – DC Cronbach’s Alpha = 0,916
                   DC1               11.55             5.194            .797              .896
                   DC2               11.44             5.293            .782              .901
                   DC3               11.52             4.995            .839              .881
                   DC4               11.51             5.025            .817              .889
                   Digital Application (DA) Cronbach’s Alpha = 0,869
                   DA1               9.57              8.508            .660              .856
                   DA2               9.82              8.332            .685              .846
                   DA3               9.76              7.912            .773              .811
                   DA4               9.70              7.696            .766              .813
                                                                                           Source: Author
                        The results indicate that all constructs meet these criteria, demonstrating
                  satisfactory internal consistency. Specifically, Digital Infrastructure (DI) shows a
                  Cronbach’s Alpha of 0.835, with item–total correlations ranging from 0.587 to 0.804.
                  Digital Leadership (DL) achieves an Alpha of 0.797, with correlations from 0.445 to 0.703;
                  although DL2 has the lowest value, it remains above the acceptable threshold and is
                  retained. Digital Capability (DC) exhibits very high reliability (Alpha = 0.916), with strong
                  item–total correlations (0.782 – 0.839). Similarly, Digital Application (DA) demonstrates
                  high reliability (Alpha = 0.869), with correlations ranging from 0.660 to 0.773. In addition,
                  the Cronbach’s Alpha if Item Deleted values are lower than the overall Alpha values for all
                  constructs, indicating that removing any item would not improve reliability. Therefore, all
                  observed variables are retained for subsequent analysis. Overall, the results confirm that
                  the measurement scales exhibit adequate reliability and internal consistency, satisfying
                  the requirements for further Exploratory Factor Analysis (EFA).
                        4.2. Exploratory factor analysis (EFA)
                                                  Table 2. KMO and Bartlett's Test
                                 Kaiser-Meyer-Olkin     Measure     of    Sampling
                                Adequacy.                                            .883
                                                           Approx. Chi-Square        1953.272
                                 Bartlett's    Test     of  df                       120
                                Sphericity
                                                           Sig.                      .000
                        Following the reliability assessment, Exploratory Factor Analysis (EFA) was
                  conducted to examine the convergent and discriminant validity of the constructs.
                        The suitability of the data was confirmed by the Kaiser–Meyer–Olkin (KMO)
                  measure and Bartlett’s Test of Sphericity. The KMO value of 0.883 exceeds the
                  recommended      threshold   of   0.5,  indicating  adequate    sampling   and    strong
                  correlationamong variables. Bartlett’s Test is statistically significant (χ² = 1953.272, p <

                  777