
Page 377 - ISC PROCEEDINGS 21.4
P. 377
Component
Item
1 2 3 4 5 6
CRMC4 0.657
CRMC1 0.578
Extraction Method: Principal Component Analysis. Rotation Method: Varimax with
Kaiser Normalization.
a. Rotation converged in 6 iterations.
Source: Compiled from SPSS 26 output
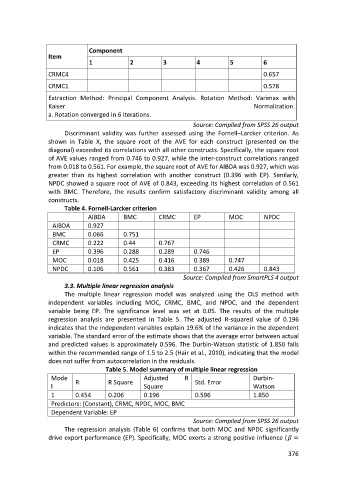
Discriminant validity was further assessed using the Fornell–Larcker criterion. As
shown in Table X, the square root of the AVE for each construct (presented on the
diagonal) exceeded its correlations with all other constructs. Specifically, the square root
of AVE values ranged from 0.746 to 0.927, while the inter-construct correlations ranged
from 0.018 to 0.561. For example, the square root of AVE for AIBDA was 0.927, which was
greater than its highest correlation with another construct (0.396 with EP). Similarly,
NPDC showed a square root of AVE of 0.843, exceeding its highest correlation of 0.561
with BMC. Therefore, the results confirm satisfactory discriminant validity among all
constructs.
Table 4. Fornell-Larcker criterion
AIBDA BMC CRMC EP MOC NPDC
AIBDA 0.927
BMC 0.066 0.751
CRMC 0.222 0.44 0.767
EP 0.396 0.288 0.289 0.746
MOC 0.018 0.425 0.416 0.389 0.747
NPDC 0.106 0.561 0.383 0.367 0.426 0.843
Source: Compiled from SmartPLS 4 output
3.3. Multiple linear regression analysis
The multiple linear regression model was analyzed using the OLS method with
independent variables including MOC, CRMC, BMC, and NPDC, and the dependent
variable being EP. The significance level was set at 0.05. The results of the multiple
regression analysis are presented in Table 5. The adjusted R-squared value of 0.196
indicates that the independent variables explain 19.6% of the variance in the dependent
variable. The standard error of the estimate shows that the average error between actual
and predicted values is approximately 0.596. The Durbin-Watson statistic of 1.850 falls
within the recommended range of 1.5 to 2.5 (Hair et al., 2010), indicating that the model
does not suffer from autocorrelation in the residuals.
Table 5. Model summary of multiple linear regression
Mode Adjusted R Durbin-
l R R Square Square Std. Error Watson
1 0.454 0.206 0.196 0.596 1.850
Predictors: (Constant), CRMC, NPDC, MOC, BMC
Dependent Variable: EP
Source: Compiled from SPSS 26 output
The regression analysis (Table 6) confirms that both MOC and NPDC significantly
drive export performance (EP). Specifically, MOC exerts a strong positive influence ( =
376