
Page 373 - ISC PROCEEDINGS 21.4
P. 373
2.3. Methodology
2.3.1. Measurement
This study employs a quantitative survey design, utilizing measurement scales
adapted from established academic literature to ensure high validity and reliability. To
achieve semantic and conceptual equivalence, all items underwent a rigorous translation
and back-translation process conducted by independent professional linguists. Constructs
were measured using a five-point Likert scale, ranging from 1 (Strongly disagree) to 5
(Strongly agree). Furthermore, a pilot test with 10–15 business managers was conducted
to refine the items for clarity and contextual appropriateness within the Vietnamese SME
environment. The complete list of items and sources is available in Appendix 1.
2.3.2. Sample and data collection
The target population comprises senior managers (e.g., directors, department heads)
from export-oriented SMEs in Vietnam that have integrated Artificial Intelligence and Big
Data Analytics (AIBDA) into their operations. Due to the lack of a comprehensive public
database of such firms, a combination of purposive and snowball sampling was employed.
Critically, AIBDA is treated not as a binary adoption variable, but as a continuous
construct reflecting the maturity and intensity of its integration into activities such as
market sensing, forecasting, and decision-making. Higher scores, therefore, indicate more
advanced and systematic utilization.
Data were collected via face-to-face interview-based surveys to maximize response
rates and ensure data precision by allowing for real-time clarification, thereby reducing
non-response bias (Sekaran, 1984). To mitigate common method bias, several procedural
remedies were implemented: respondents were guaranteed anonymity and
confidentiality, independent and dependent variables were placed in separate sections,
and neutral wording was used to minimize evaluation apprehension. Each participant
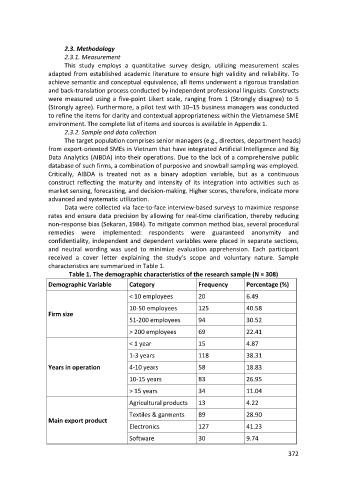
received a cover letter explaining the study’s scope and voluntary nature. Sample
characteristics are summarized in Table 1.
Table 1. The demographic characteristics of the research sample (N = 308)
Demographic Variable Category Frequency Percentage (%)
< 10 employees 20 6.49
10-50 employees 125 40.58
Firm size
51-200 employees 94 30.52
> 200 employees 69 22.41
< 1 year 15 4.87
1-3 years 118 38.31
Years in operation 4-10 years 58 18.83
10-15 years 83 26.95
> 15 years 34 11.04
Agricultural products 13 4.22
Textiles & garments 89 28.90
Main export product
Electronics 127 41.23
Software 30 9.74
372