
Page 375 - ISC PROCEEDINGS 21.4
P. 375
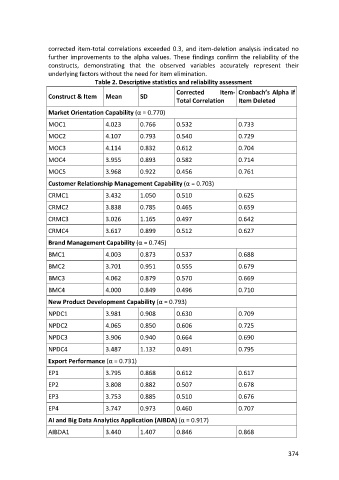
corrected item-total correlations exceeded 0.3, and item-deletion analysis indicated no
                  further improvements to the alpha values. These findings confirm the reliability of the
                  constructs, demonstrating that the observed variables accurately represent their
                  underlying factors without the need for item elimination.
                                  Table 2. Descriptive statistics and reliability assessment
                                                               Corrected      Item- Cronbach’s Alpha if
                  Construct & Item    Mean        SD
                                                               Total Correlation     Item Deleted

                  Market Orientation Capability (α = 0.770)
                  MOC1                4.023       0.766        0.532                 0.733

                  MOC2                4.107       0.793        0.540                 0.729
                  MOC3                4.114       0.832        0.612                 0.704

                  MOC4                3.955       0.893        0.582                 0.714

                  MOC5                3.968       0.922        0.456                 0.761
                  Customer Relationship Management Capability (α = 0.703)

                  CRMC1               3.432       1.050        0.510                 0.625
                  CRMC2               3.838       0.785        0.465                 0.659

                  CRMC3               3.026       1.165        0.497                 0.642

                  CRMC4               3.617       0.899        0.512                 0.627
                  Brand Management Capability (α = 0.745)

                  BMC1                4.003       0.873        0.537                 0.688
                  BMC2                3.701       0.951        0.555                 0.679

                  BMC3                4.062       0.879        0.570                 0.669
                  BMC4                4.000       0.849        0.496                 0.710

                  New Product Development Capability (α = 0.793)

                  NPDC1               3.981       0.908        0.630                 0.709
                  NPDC2               4.065       0.850        0.606                 0.725

                  NPDC3               3.906       0.940        0.664                 0.690

                  NPDC4               3.487       1.132        0.491                 0.795
                  Export Performance (α = 0.731)

                  EP1                 3.795       0.868        0.612                 0.617
                  EP2                 3.808       0.882        0.507                 0.678

                  EP3                 3.753       0.885        0.510                 0.676
                  EP4                 3.747       0.973        0.460                 0.707

                  AI and Big Data Analytics Application (AIBDA) (α = 0.917)

                  AIBDA1              3.440       1.407        0.846                 0.868


                                                                                                      374