
Page 374 - ISC PROCEEDINGS 21.4
P. 374
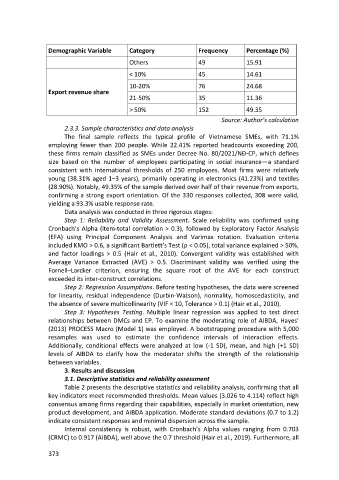
Demographic Variable        Category                 Frequency        Percentage (%)

                                              Others                   49               15.91
                                              < 10%                    45               14.61

                                              10-20%                   76               24.68
                  Export revenue share
                                              21-50%                   35               11.36

                                              > 50%                    152              49.35
                                                                               Source: Author’s calculation
                        2.3.3. Sample characteristics and data analysis
                        The final sample reflects the typical profile of Vietnamese SMEs, with 71.1%
                  employing fewer than 200 people. While 22.41% reported headcounts exceeding 200,
                  these firms remain classified as SMEs under Decree No. 80/2021/NĐ-CP, which defines
                  size based on the number of employees participating in social insurance—a standard
                  consistent with international thresholds of 250 employees. Most firms were relatively
                  young (38.31% aged 1–3 years), primarily operating in electronics (41.23%) and textiles
                  (28.90%). Notably, 49.35% of the sample derived over half of their revenue from exports,
                  confirming a strong export orientation. Of the 330 responses collected, 308 were valid,
                  yielding a 93.3% usable response rate.
                        Data analysis was conducted in three rigorous stages:
                        Step 1: Reliability and Validity Assessment. Scale reliability was confirmed using
                  Cronbach’s Alpha (item-total correlation > 0.3), followed by Exploratory Factor Analysis
                  (EFA) using Principal Component Analysis and Varimax rotation. Evaluation criteria
                  included KMO > 0.6, a significant Bartlett’s Test (p < 0.05), total variance explained > 50%,
                  and factor loadings > 0.5 (Hair et al., 2010). Convergent validity was established with
                  Average Variance Extracted (AVE) > 0.5. Discriminant validity was verified using the
                  Fornell–Larcker criterion, ensuring the square root of the AVE for each construct
                  exceeded its inter-construct correlations.
                        Step 2: Regression Assumptions. Before testing hypotheses, the data were screened
                  for linearity, residual independence (Durbin-Watson), normality, homoscedasticity, and
                  the absence of severe multicollinearity (VIF < 10, Tolerance > 0.1) (Hair et al., 2010).
                        Step 3: Hypotheses Testing. Multiple linear regression was applied to test direct
                  relationships between DMCs and EP. To examine the moderating role of AIBDA, Hayes’
                  (2013) PROCESS Macro (Model 1) was employed. A bootstrapping procedure with 5,000
                  resamples was used to estimate the confidence intervals of interaction effects.
                  Additionally, conditional effects were analyzed at low (-1 SD), mean, and high (+1 SD)
                  levels of AIBDA to clarify how the moderator shifts the strength of the relationship
                  between variables.
                        3. Results and discussion
                        3.1. Descriptive statistics and reliability assessment
                        Table 2 presents the descriptive statistics and reliability analysis, confirming that all
                  key indicators meet recommended thresholds. Mean values (3.026 to 4.114) reflect high
                  consensus among firms regarding their capabilities, especially in market orientation, new
                  product development, and AIBDA application. Moderate standard deviations (0.7 to 1.2)
                  indicate consistent responses and minimal dispersion across the sample.
                        Internal consistency is robust, with Cronbach’s Alpha values ranging from 0.703
                  (CRMC) to 0.917 (AIBDA), well above the 0.7 threshold (Hair et al., 2019). Furthermore, all

                  373