
Page 477 - Demo
P. 477
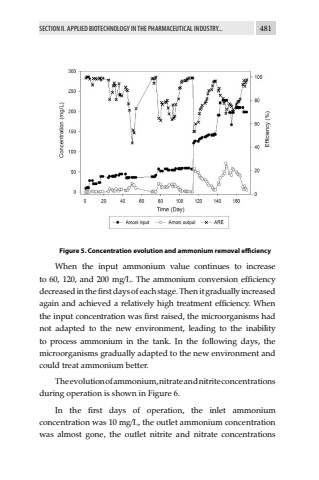
SECTION II. APPLIED BIOTECHNOLOGY IN THE PHARMACEUTICAL INDUSTRY... 481Figure 5. Concentration evolution and ammonium removal efficiencyWhen the input ammonium value continues to increase to 60, 120, and 200 mg/L. The ammonium conversion efficiency decreased in the first days of each stage. Then it gradually increased again and achieved a relatively high treatment efficiency. When the input concentration was first raised, the microorganisms had not adapted to the new environment, leading to the inability to process ammonium in the tank. In the following days, the microorganisms gradually adapted to the new environment and could treat ammonium better.The evolution of ammonium, nitrate and nitrite concentrations during operation is shown in Figure 6.In the first days of operation, the inlet ammonium concentration was 10 mg/L, the outlet ammonium concentration was almost gone, the outlet nitrite and nitrate concentrations
