
Page 459 - Demo
P. 459
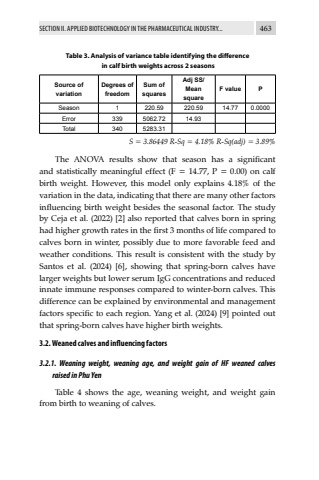
SECTION II. APPLIED BIOTECHNOLOGY IN THE PHARMACEUTICAL INDUSTRY... 463Table 3. Analysis of variance table identifying the difference in calf birth weights across 2 seasonsSource of variationDegrees of freedomSum of squaresAdj SS/ Mean squareF value PSeason 1 220.59 220.59 14.77 0.0000Error 339 5062.72 14.93Total 340 5283.31S = 3.86449 R-Sq = 4.18% R-Sq(adj) = 3.89%The ANOVA results show that season has a significant and statistically meaningful effect (F = 14.77, P = 0.00) on calf birth weight. However, this model only explains 4.18% of the variation in the data, indicating that there are many other factors influencing birth weight besides the seasonal factor. The study by Ceja et al. (2022) [2] also reported that calves born in spring had higher growth rates in the first 3 months of life compared to calves born in winter, possibly due to more favorable feed and weather conditions. This result is consistent with the study by Santos et al. (2024) [6], showing that spring-born calves have larger weights but lower serum IgG concentrations and reduced innate immune responses compared to winter-born calves. This difference can be explained by environmental and management factors specific to each region. Yang et al. (2024) [9] pointed out that spring-born calves have higher birth weights.3.2. Weaned calves and influencing factors3.2.1. Weaning weight, weaning age, and weight gain of HF weaned calves raised in Phu YenTable 4 shows the age, weaning weight, and weight gain from birth to weaning of calves.
