Page 512 - Ebook HTKH 2024
P. 512
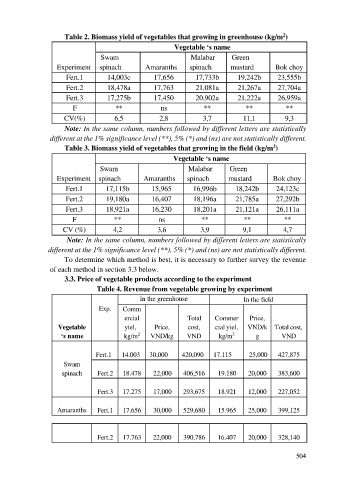
Table 2. Biomass yield of vegetables that growing in greenhouse (kg/m )
                                                                                                     2
                                                              Vegetable ‘s name

                                    Swam                            Malabar        Green
                     Experiment  spinach            Amaranths       spinach       mustard         Bok choy
                        Fert.1         14,003c         17,656         17,733b        19,242b       23,555b
                        Fert.2         18,478a         17,763         21,081a        21,267a       27,704a
                        Fert.3         17,275b         17,450         20,902a        21,222a       26,959a

                           F              **              ns             **            **             **
                        CV(%)            6,5             2,8            3,7           11,1           9,3
                        Note: In the same column, numbers followed by different letters are statistically
                   different at the 1% significance level (**), 5% (*) and (ns) are not statistically different.

                                                                                                 2
                        Table 3. Biomass yield of vegetables that growing in the field (kg/m )
                                                              Vegetable ‘s name
                                    Swam                           Malabar        Green
                     Experiment  spinach           Amaranths       spinach       mustard         Bok choy
                        Fert.1        17,115b         15,965         16,996b        18,242b       24,123c

                        Fert.2        19,180a         16,407         18,196a        21,785a       27,292b
                        Fert.3        18,921a         16,230         18,201a        21,121a       26,111a
                          F              **              ns             **             **            **

                       CV (%)            4,2            3,6             3,9           9,1            4,7
                        Note: In the same column, numbers followed by different letters are statistically
                  different at the 1% significance level (**), 5% (*) and (ns) are not statistically different.
                        To determine which method is best, it is necessary to further survey the revenue
                   of each method in section 3.3 below.
                        3.3. Price of vegetable products according to the experiment
                                   Table 4. Revenue from vegetable growing by experiment

                                                  In the greenhouse                    In the field
                                    Exp.    Comm

                                             ercial                Total     Commer      Price,
                     Vegetable               yiel,     Price,      cost,     cial yiel,   VND/k  Total cost,
                                                                                   2
                                                 2
                      ‘s name                kg/m     VND/kg       VND        kg/m         g        VND

                                   Fert.1   14.003    30,000     420,090    17.115       25,000    427,875
                       Swam
                       spinach     Fert.2   18.478     22,000    406,516      19.180    20,000     383,600

                                   Fert.3   17.275     17,000    293,675      18.921    12,000     227,052

                     Amaranths     Fert.1   17.656     30,000    529,680      15.965    25,000     399,125


                                   Fert.2   17.763     22,000    390,786      16.407    20,000     328,140


                                                                                                         504

