
Page 220 - Ebook HTKH 2024
P. 220
decisions. The results of EFA must meet certain requirements, with the Bartlett’s Test
significance value (Sig.) being less than 0.05, allowing rejection of the null hypothesis
(H0). Kaiser-Meyer-Olkin (KMO) values between 0.5 and 1 indicate appropriateness
for factor analysis. If this value is less than 0.5, factor analysis is not suitable for the
research dataset (Hoang Trong & Chu Nguyen Mong Ngoc, 2008). The results of the
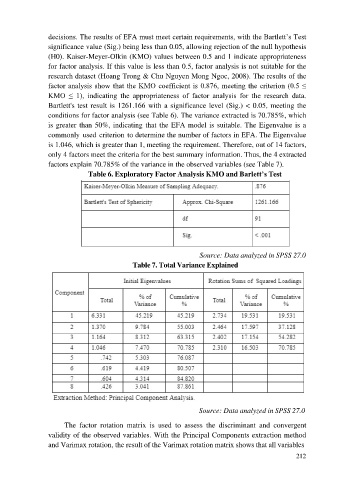
factor analysis show that the KMO coefficient is 0.876, meeting the criterion (0.5 ≤
KMO ≤ 1), indicating the appropriateness of factor analysis for the research data.
Bartlett's test result is 1261.166 with a significance level (Sig.) < 0.05, meeting the
conditions for factor analysis (see Table 6). The variance extracted is 70.785%, which
is greater than 50%, indicating that the EFA model is suitable. The Eigenvalue is a
commonly used criterion to determine the number of factors in EFA. The Eigenvalue
is 1.046, which is greater than 1, meeting the requirement. Therefore, out of 14 factors,
only 4 factors meet the criteria for the best summary information. Thus, the 4 extracted
factors explain 70.785% of the variance in the observed variables (see Table 7).
Table 6. Exploratory Factor Analysis KMO and Barlett’s Test
Source: Data analyzed in SPSS 27.0
Table 7. Total Variance Explained
Source: Data analyzed in SPSS 27.0
The factor rotation matrix is used to assess the discriminant and convergent
validity of the observed variables. With the Principal Components extraction method
and Varimax rotation, the result of the Varimax rotation matrix shows that all variables
212