
Page 222 - Ebook HTKH 2024
P. 222
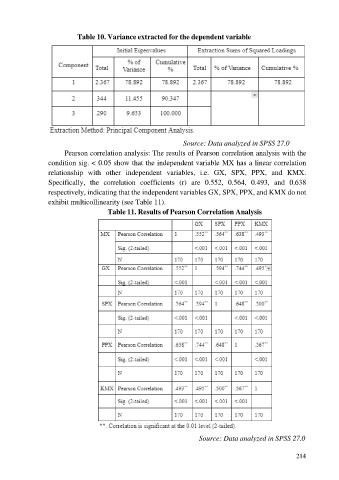
Table 10. Variance extracted for the dependent variable


                                                                 Source: Data analyzed in SPSS 27.0

                        Pearson correlation analysis: The results of Pearson correlation analysis with the
                  condition sig. < 0.05 show that the independent variable MX has a linear correlation
                  relationship  with  other  independent  variables,  i.e.  GX,  SPX,  PPX,  and  KMX.
                  Specifically,  the  correlation  coefficients  (r)  are  0.552,  0.564,  0.493,  and  0.638
                  respectively, indicating that the independent variables GX, SPX, PPX, and KMX do not
                  exhibit multicollinearity (see Table 11).

                                       Table 11. Results of Pearson Correlation Analysis


                                                                       Source: Data analyzed in SPSS 27.0


                                                                                                         214