
Page 223 - Ebook HTKH 2024
P. 223
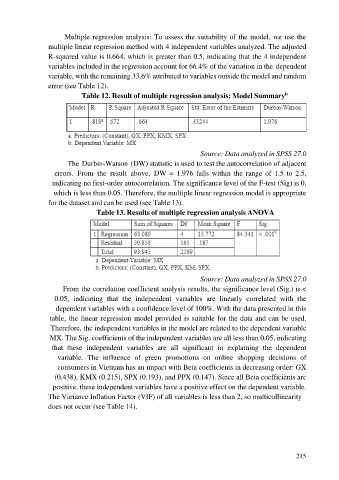
Multiple regression analysis: To assess the suitability of the model, we use the
                  multiple linear regression method with 4 independent variables analyzed. The adjusted

                  R-squared value is 0.664, which is greater than 0.5, indicating that the 4 independent
                  variables included in the regression account for 66.4% of the variation in the dependent
                  variable, with the remaining 33.6% attributed to variables outside the model and random
                  error (see Table 12).
                                                                                                     b
                              Table 12. Result of multiple regression analysis: Model Summary


                                                                       Source: Data analyzed in SPSS 27.0
                         The Durbin-Watson (DW) statistic is used to test the autocorrelation of adjacent
                    errors.  From  the  result  above,  DW  =  1.976  falls  within  the  range  of  1.5  to  2.5,
                   indicating no first-order autocorrelation. The significance level of the F-test (Sig) is 0,
                    which is less than 0.05. Therefore, the multiple linear regression model is appropriate

                  for the dataset and can be used (see Table 13).
                                   Table 13. Results of multiple regression analysis ANOVA


                                                                       Source: Data analyzed in SPSS 27.0
                       From the correlation coefficient analysis results, the significance level (Sig.) is <
                    0.05,  indicating  that  the  independent  variables  are  linearly  correlated  with  the

                     dependent variables with a confidence level of 100%. With the data presented in this
                   table,  the  linear  regression  model provided is suitable for the data and can be used.
                   Therefore, the independent variables in the model are related to the dependent variable
                   MX. The Sig. coefficients of the independent variables are all less than 0.05, indicating
                   that  these  independent  variables  are  all  significant  in  explaining  the  dependent

                     variable.  The  influence  of  green  promotions  on  online  shopping  decisions  of
                     consumers in Vietnam has an impact with Beta coefficients in decreasing order: GX
                    (0.438), KMX (0.215), SPX (0.193), and PPX (0.147). Since all Beta coefficients are
                    positive, these independent variables have a positive effect on the dependent variable.
                  The Variance Inflation Factor (VIF) of all variables is less than 2, so multicollinearity
                  does not occur (see Table 14).


                                                                                                         215