
Page 221 - Ebook HTKH 2024
P. 221
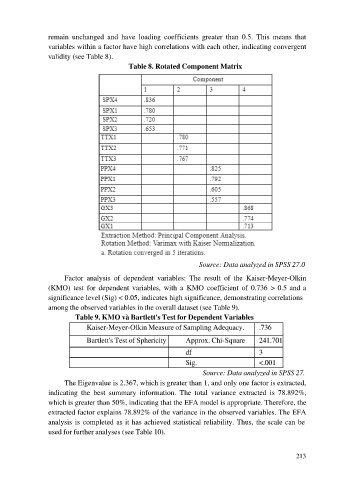
remain  unchanged  and  have  loading  coefficients  greater  than  0.5.  This  means  that
                  variables within a factor have high correlations with each other, indicating convergent

                  validity (see Table 8).
                                              Table 8. Rotated Component Matrix


                                                                       Source: Data analyzed in SPSS 27.0

                        Factor  analysis  of  dependent  variables:  The  result  of  the  Kaiser-Meyer-Olkin
                  (KMO)  test  for  dependent  variables,  with  a  KMO  coefficient  of  0.736  > 0.5 and a
                  significance level (Sig) < 0.05, indicates high significance, demonstrating correlations
                  among the observed variables in the overall dataset (see Table 9).

                           Table 9. KMO và Bartlett's Test for Dependent Variables
                                Kaiser-Meyer-Olkin Measure of Sampling Adequacy.            .736

                                Bartlett's Test of Sphericity     Approx. Chi-Square        241.701
                                                                  df                        3
                                                                  Sig.                      <.001

                                                                        Source: Data analyzed in SPSS 27.
                        The Eigenvalue is 2.367, which is greater than 1, and only one factor is extracted,
                  indicating  the  best  summary  information.  The  total  variance  extracted  is  78.892%,
                  which is greater than 50%, indicating that the EFA model is appropriate. Therefore, the

                  extracted factor explains 78.892% of the variance in the observed variables. The EFA
                  analysis  is  completed as it has achieved statistical reliability. Thus, the scale can be
                  used for further analyses (see Table 10).


                                                                                                         213