
Page 821 - ISC PROCEEDINGS 21.4
P. 821
3. Methodologies of research
3.1. Sampling and data acquisition
Utilising a synthesis of prior research, the authors created a preliminary survey
questionnaire and executed a pilot survey with 50 participants (n = 50) to assess the clarity
and appropriateness of the observed factors in the scale. The pilot survey results were
utilised to modify and enhance the official questionnaire prior to executing a large-scale
survey. The research employed a convenience sample strategy, targeting accounting
lecturers and third- and fourth-year accounting students at institutions. These entities are
directly engaged in the educational process and are thus equipped to assess the degree of
innovation in accounting pedagogy. The poll yielded 295 valid replies, which were utilised for
the subsequent analytical procedures.
3.2. Research methodology
The study employed a mixed-methods approach, integrating qualitative and
quantitative techniques. Qualitative research encompasses a literature review and analysis
of prior studies to ascertain elements that may affect teaching innovation in accounting
education, so establishing a foundation for presenting a model and research hypotheses.
Consequently, quantitative research was undertaken to evaluate the proposed model and
hypotheses. Data for the research was gathered via an online survey targeting accounting
lecturers and third- and fourth-year accounting students at institutions from December 2025
to January 2026. The survey instrument was constructed with a 5-point Likert scale. Prior to
administering the official survey, a pilot survey was executed including 50 lecturers and
professionals in accounting to evaluate and refine the questionnaire content. The official
survey produced 295 legitimate replies, which were utilised for data analysis. The data were
analysed using SPSS 26 software employing techniques like descriptive statistics, scale
reliability assessment, and regression analysis to evaluate the correlations among variables
in the research model.
4. Research findings
4.1. Evaluating the reliability of the scales
The reliability of the scales was assessed using Cronbach's Alpha coefficient. The
analytical results indicated that the majority of the observed variables satisfied the criteria
(Cronbach's Alpha coefficient ≥ 0.6 and item-total correlation coefficient ≥ 0.3). Following
Cronbach's Alpha assessment, the study model kept 6 independent variables and 1
dependent variable, including 22 observed variables, for exploratory factor analysis (EFA).
The independent variables were analysed concurrently, whilst the dependent variable
"Innovation in accounting teaching methods" was examined independently. The
independent variable values were evaluated using fundamental statistical techniques,
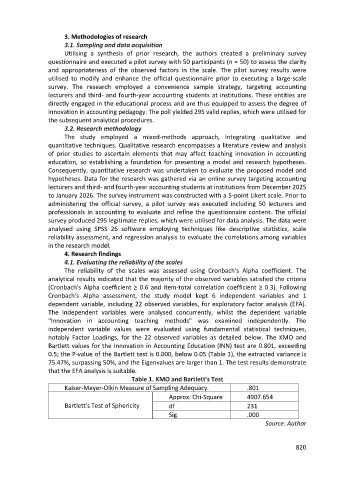
notably Factor Loadings, for the 22 observed variables as detailed below. The KMO and
Bartlett values for the Innovation in Accounting Education (INN) test are 0.801, exceeding
0.5; the P-value of the Bartlett test is 0.000, below 0.05 (Table 1), the extracted variance is
75.47%, surpassing 50%, and the Eigenvalues are larger than 1. The test results demonstrate
that the EFA analysis is suitable.
Table 1. KMO and Bartlett's Test
Kaiser-Meyer-Olkin Measure of Sampling Adequacy. .801
Approx. Chi-Square 4907.654
Bartlett's Test of Sphericity df 231
Sig. .000
Source: Author
820