Page 822 - ISC PROCEEDINGS 21.4
P. 822

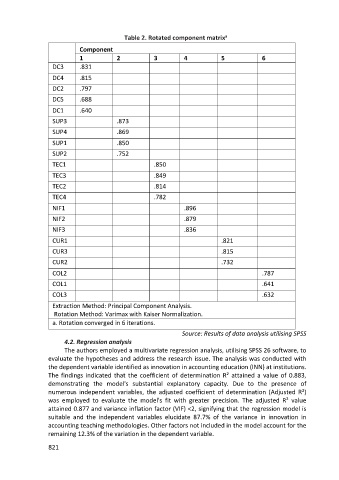
Table 2. Rotated component matrix  a

                             Component
                             1            2            3          4            5             6
                   DC3       .831
                   DC4       .815
                   DC2       .797

                   DC5       .688
                   DC1       .640

                   SUP3                   .873
                   SUP4                   .869
                   SUP1                   .850

                   SUP2                   .752
                   TEC1                                .850
                   TEC3                                .849

                   TEC2                                .814
                   TEC4                                .782
                   NIF1                                           .896

                   NIF2                                           .879
                   NIF3                                           .836

                   CUR1                                                        .821
                   CUR3                                                        .815
                   CUR2                                                        .732

                   COL2                                                                      .787
                   COL1                                                                      .641

                   COL3                                                                      .632
                   Extraction Method: Principal Component Analysis.
                    Rotation Method: Varimax with Kaiser Normalization.
                   a. Rotation converged in 6 iterations.
                                                                 Source: Results of data analysis utilising SPSS
                        4.2. Regression analysis
                        The authors employed a multivariate regression analysis, utilising SPSS 26 software, to
                  evaluate the hypotheses and address the research issue. The analysis was conducted with
                  the dependent variable identified as innovation in accounting education (INN) at institutions.
                  The findings indicated that the coefficient of determination R² attained a value of 0.883,
                  demonstrating the model's substantial explanatory capacity. Due to the presence of
                  numerous independent variables, the adjusted coefficient of determination (Adjusted R²)
                  was employed to evaluate the model's fit with greater precision. The adjusted R² value
                  attained 0.877 and variance inflation factor (VIF) <2, signifying that the regression model is
                  suitable and the independent variables elucidate 87.7% of the variance in innovation in
                  accounting teaching methodologies. Other factors not included in the model account for the
                  remaining 12.3% of the variation in the dependent variable.

                  821
   817   818   819   820   821   822   823   824   825   826