
Page 772 - ISC PROCEEDINGS 21.4
P. 772
4.4 Company Stage Analysis and Organizational Vulnerabilities
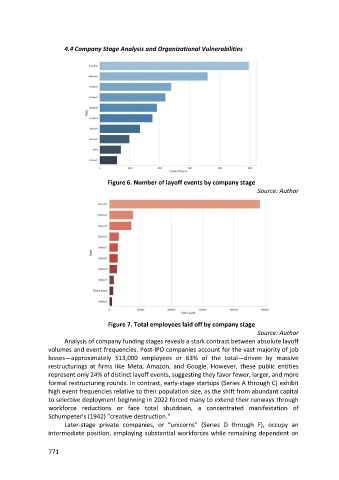
Figure 6. Number of layoff events by company stage
Source: Author
Figure 7. Total employees laid off by company stage
Source: Author
Analysis of company funding stages reveals a stark contrast between absolute layoff
volumes and event frequencies. Post-IPO companies account for the vast majority of job
losses—approximately 513,000 employees or 63% of the total—driven by massive
restructurings at firms like Meta, Amazon, and Google. However, these public entities
represent only 24% of distinct layoff events, suggesting they favor fewer, larger, and more
formal restructuring rounds. In contrast, early-stage startups (Series A through C) exhibit
high event frequencies relative to their population size, as the shift from abundant capital
to selective deployment beginning in 2022 forced many to extend their runways through
workforce reductions or face total shutdown, a concentrated manifestation of
Schumpeter's (1942) "creative destruction."
Later-stage private companies, or “unicorns” (Series D through F), occupy an
intermediate position, employing substantial workforces while remaining dependent on
771