
Page 769 - ISC PROCEEDINGS 21.4
P. 769
surge occurred in 2023 and 2024, accounting for over 60% of cumulative job losses. This
temporal lag suggests a delayed correction to pandemic-era over-hiring rather than an
immediate reaction to the initial 2020 shock.
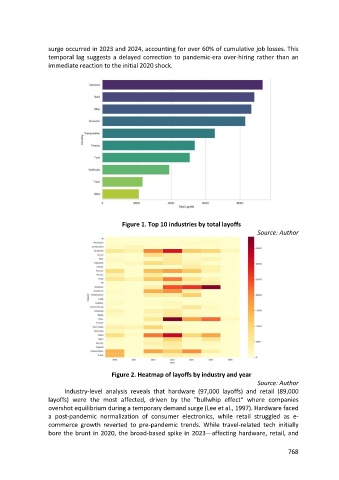
Figure 1. Top 10 industries by total layoffs
Source: Author
Figure 2. Heatmap of layoffs by industry and year
Source: Author
Industry-level analysis reveals that hardware (97,000 layoffs) and retail (89,000
layoffs) were the most affected, driven by the "bullwhip effect" where companies
overshot equilibrium during a temporary demand surge (Lee et al., 1997). Hardware faced
a post-pandemic normalization of consumer electronics, while retail struggled as e-
commerce growth reverted to pre-pandemic trends. While travel-related tech initially
bore the brunt in 2020, the broad-based spike in 2023—affecting hardware, retail, and
768