
Page 771 - ISC PROCEEDINGS 21.4
P. 771
and New York. This mirrors the industry clustering and agglomeration effects described by
Glaeser and Gottlieb (2009), where specialized labor pools that drive productivity during
growth phases can simultaneously amplify the severity of downturns through negative
feedback loops in local economies.
Beyond the U.S., India follows with 86,000 layoffs (11%), reflecting its dual role as a
burgeoning startup ecosystem and a global operations hub for multinational corporations.
European activity is more diffuse, with notable clusters in Germany (5%), the UK (4%), and
Sweden (3%). Geographic heat mapping reveals that while the U.S. remains the epicenter,
technology employment has globalized sufficiently for layoff waves to propagate across
Southeast Asia, South America, and Israel. This spatial distribution, as noted by Glaeser
and Gottlieb (2009), underscores how multinational restructuring decisions—whether
implemented proportionally or targeted at specific offshore functions—interact with
regional labor markets to create a truly global phenomenon.
4.3 Temporal Dynamics and Cyclical Patterns
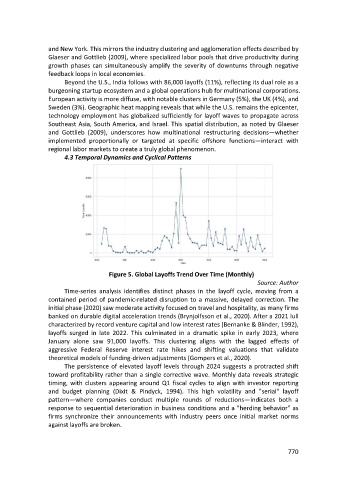
Figure 5. Global Layoffs Trend Over Time (Monthly)
Source: Author
Time-series analysis identifies distinct phases in the layoff cycle, moving from a
contained period of pandemic-related disruption to a massive, delayed correction. The
initial phase (2020) saw moderate activity focused on travel and hospitality, as many firms
banked on durable digital acceleration trends (Brynjolfsson et al., 2020). After a 2021 lull
characterized by record venture capital and low interest rates (Bernanke & Blinder, 1992),
layoffs surged in late 2022. This culminated in a dramatic spike in early 2023, where
January alone saw 91,000 layoffs. This clustering aligns with the lagged effects of
aggressive Federal Reserve interest rate hikes and shifting valuations that validate
theoretical models of funding-driven adjustments (Gompers et al., 2020).
The persistence of elevated layoff levels through 2024 suggests a protracted shift
toward profitability rather than a single corrective wave. Monthly data reveals strategic
timing, with clusters appearing around Q1 fiscal cycles to align with investor reporting
and budget planning (Dixit & Pindyck, 1994). This high volatility and "serial" layoff
pattern—where companies conduct multiple rounds of reductions—indicates both a
response to sequential deterioration in business conditions and a "herding behavior" as
firms synchronize their announcements with industry peers once initial market norms
against layoffs are broken.
770