
Page 728 - ISC PROCEEDINGS 21.4
P. 728
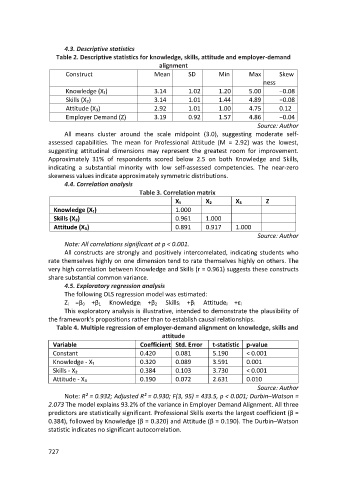
4.3. Descriptive statistics
Table 2. Descriptive statistics for knowledge, skills, attitude and employer-demand
alignment
Construct Mean SD Min Max Skew
ness
Knowledge (X₁) 3.14 1.02 1.20 5.00 −0.08
Skills (X₂) 3.14 1.01 1.44 4.89 −0.08
Attitude (X₃) 2.92 1.01 1.00 4.75 0.12
Employer Demand (Z) 3.19 0.92 1.57 4.86 −0.04
Source: Author
All means cluster around the scale midpoint (3.0), suggesting moderate self-
assessed capabilities. The mean for Professional Attitude (M = 2.92) was the lowest,
suggesting attitudinal dimensions may represent the greatest room for improvement.
Approximately 31% of respondents scored below 2.5 on both Knowledge and Skills,
indicating a substantial minority with low self-assessed competencies. The near-zero
skewness values indicate approximately symmetric distributions.
4.4. Correlation analysis
Table 3. Correlation matrix
X₁ X₂ X₃ Z
Knowledge (X₁) 1.000
Skills (X₂) 0.961 1.000
Attitude (X₃) 0.891 0.917 1.000
Source: Author
Note: All correlations significant at p < 0.001.
All constructs are strongly and positively intercorrelated, indicating students who
rate themselves highly on one dimension tend to rate themselves highly on others. The
very high correlation between Knowledge and Skills (r = 0.961) suggests these constructs
share substantial common variance.
4.5. Exploratory regression analysis
The following OLS regression model was estimated:
Z i =β 0 +β 1 Knowledge i +β 2 Skills i +β i Attitude i +ε i
This exploratory analysis is illustrative, intended to demonstrate the plausibility of
the framework's propositions rather than to establish causal relationships.
Table 4. Multiple regression of employer-demand alignment on knowledge, skills and
attitude
Variable Coefficient Std. Error t-statistic p-value
Constant 0.420 0.081 5.190 < 0.001
Knowledge - X₁ 0.320 0.089 3.591 0.001
Skills - X₂ 0.384 0.103 3.730 < 0.001
Attitude - X₃ 0.190 0.072 2.631 0.010
Source: Author
Note: R² = 0.932; Adjusted R² = 0.930; F(3, 95) = 433.5, p < 0.001; Durbin–Watson =
2.073 The model explains 93.2% of the variance in Employer Demand Alignment. All three
predictors are statistically significant. Professional Skills exerts the largest coefficient (β =
0.384), followed by Knowledge (β = 0.320) and Attitude (β = 0.190). The Durbin–Watson
statistic indicates no significant autocorrelation.
727