
Page 729 - ISC PROCEEDINGS 21.4
P. 729
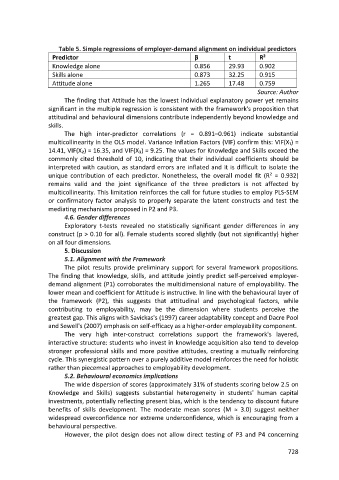
Table 5. Simple regressions of employer-demand alignment on individual predictors
                   Predictor                                         β           t          R²
                   Knowledge alone                                   0.856       29.93      0.902
                   Skills alone                                      0.873       32.25      0.915
                   Attitude alone                                    1.265       17.48      0.759
                                                                                           Source: Author
                        The finding that Attitude has the lowest individual explanatory power yet remains
                  significant in the multiple regression is consistent with the framework's proposition that
                  attitudinal and behavioural dimensions contribute independently beyond knowledge and
                  skills.
                        The high inter-predictor correlations (r = 0.891–0.961) indicate substantial
                  multicollinearity in the OLS model. Variance Inflation Factors (VIF) confirm this: VIF(X₁) =
                  14.41, VIF(X₂) = 16.35, and VIF(X₃) = 9.25. The values for Knowledge and Skills exceed the
                  commonly cited threshold of 10, indicating that their individual coefficients should be
                  interpreted with caution, as standard errors are inflated and it is difficult to isolate the
                  unique contribution of each predictor. Nonetheless, the overall model fit (R² = 0.932)
                  remains valid and the joint significance of the three predictors is not affected by
                  multicollinearity. This limitation reinforces the call for future studies to employ PLS-SEM
                  or confirmatory factor analysis to properly separate the latent constructs and test the
                  mediating mechanisms proposed in P2 and P3.
                        4.6. Gender differences
                        Exploratory t-tests revealed no statistically significant gender differences in any
                  construct (p > 0.10 for all). Female students scored slightly (but not significantly) higher
                  on all four dimensions.
                        5. Discussion
                        5.1. Alignment with the Framework
                        The pilot results provide preliminary support for several framework propositions.
                  The finding that knowledge, skills, and attitude jointly predict self-perceived employer-
                  demand alignment (P1) corroborates the multidimensional nature of employability. The
                  lower mean and coefficient for Attitude is instructive. In line with the behavioural layer of
                  the framework (P2), this suggests that attitudinal and psychological factors, while
                  contributing to employability, may be the dimension where students perceive the
                  greatest gap. This aligns with Savickas's (1997) career adaptability concept and Dacre Pool
                  and Sewell's (2007) emphasis on self-efficacy as a higher-order employability component.
                        The very high inter-construct correlations support the framework's layered,
                  interactive structure: students who invest in knowledge acquisition also tend to develop
                  stronger professional skills and more positive attitudes, creating a mutually reinforcing
                  cycle. This synergistic pattern over a purely additive model reinforces the need for holistic
                  rather than piecemeal approaches to employability development.
                        5.2. Behavioural economics implications
                        The wide dispersion of scores (approximately 31% of students scoring below 2.5 on
                  Knowledge and Skills) suggests substantial heterogeneity in students' human capital
                  investments, potentially reflecting present bias, which is the tendency to discount future
                  benefits of skills development. The moderate mean scores (M ≈ 3.0) suggest neither
                  widespread overconfidence nor extreme underconfidence, which is encouraging from a
                  behavioural perspective.
                        However, the pilot design does not allow direct testing of P3 and P4 concerning


                                                                                                      728