Page 542 - ISC PROCEEDINGS 21.4
P. 542

authors further assessed convergent validity using the Average Variance Extracted (AVE)
                  for the constructs FL, SA, PP, MA, BU, and SI. All AVE values exceeded the threshold of 0.5,
                  thereby confirming adequate convergent validity.
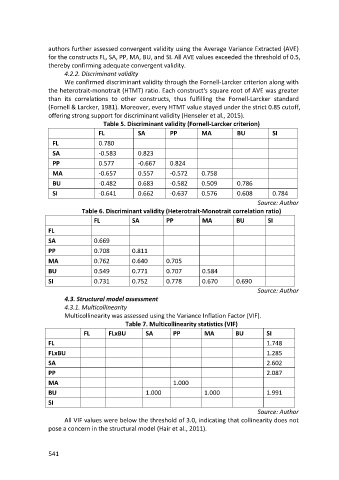
                        4.2.2. Discriminant validity
                        We confirmed discriminant validity through the Fornell-Larcker criterion along with
                  the heterotrait-monotrait (HTMT) ratio. Each construct's square root of AVE was greater
                  than its correlations to other constructs, thus fulfilling the Fornell-Larcker standard
                  (Fornell & Larcker, 1981). Moreover, every HTMT value stayed under the strict 0.85 cutoff,
                  offering strong support for discriminant validity (Henseler et al., 2015).
                                     Table 5. Discriminant validity (Fornell-Larcker criterion)
                                    FL           SA          PP         MA          BU           SI
                   FL               0.780
                   SA               -0.583       0.823

                   PP               0.577        -0.667      0.824
                   MA               -0.657       0.557       -0.572     0.758
                   BU               -0.482       0.683       -0.582     0.509       0.786
                   SI               -0.641       0.662       -0.637     0.576       0.608        0.784
                                                                                            Source: Author
                              Table 6. Discriminant validity (Heterotrait-Monotrait correlation ratio)
                                  FL           SA          PP           MA          BU         SI

                  FL
                  SA              0.669
                  PP              0.708        0.811
                  MA              0.762        0.640       0.705
                  BU              0.549        0.771       0.707        0.584

                  SI              0.731        0.752       0.778        0.670       0.690
                                                                                            Source: Author
                        4.3. Structural model assessment
                        4.3.1. Multicollinearity
                        Multicollinearity was assessed using the Variance Inflation Factor (VIF).
                                             Table 7. Multicollinearity statistics (VIF)
                              FL       FLxBU        SA        PP         MA         BU         SI
                  FL                                                                           1.748
                  FLxBU                                                                        1.285
                  SA                                                                           2.602

                  PP                                                                           2.087
                  MA                                          1.000
                  BU                                1.000                1.000                 1.991
                  SI
                                                                                            Source: Author
                        All VIF values were below the threshold of 3.0, indicating that collinearity does not
                  pose a concern in the structural model (Hair et al., 2011).


                  541
   537   538   539   540   541   542   543   544   545   546   547