
Page 541 - ISC PROCEEDINGS 21.4
P. 541
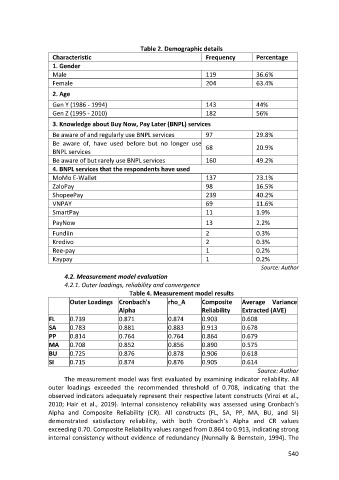
Table 2. Demographic details
                   Characteristic                                        Frequency         Percentage
                   1. Gender
                   Male                                                  119               36.6%
                   Female                                                204               63.4%

                   2. Age
                   Gen Y (1986 - 1994)                                   143               44%
                   Gen Z (1995 - 2010)                                   182               56%
                   3. Knowledge about Buy Now, Pay Later (BNPL) services
                   Be aware of and regularly use BNPL services           97                29.8%
                   Be aware of, have used before but no longer use       68                20.9%
                   BNPL services
                   Be aware of but rarely use BNPL services              160               49.2%
                   4. BNPL services that the respondents have used
                   MoMo E-Wallet                                         137               23.1%
                   ZaloPay                                               98                16.5%
                   ShopeePay                                             239               40.2%
                   VNPAY                                                 69                11.6%
                   SmartPay                                              11                1.9%
                   PayNow                                                13                2.2%
                   Fundiin                                               2                 0.3%
                   Kredivo                                               2                 0.3%
                   Ree-pay                                               1                 0.2%
                   Kaypay                                                1                 0.2%
                                                                                             Source: Author
                        4.2. Measurement model evaluation
                        4.2.1. Outer loadings, reliability and convergence
                                               Table 4. Measurement model results
                          Outer Loadings Cronbach's         rho_A       Composite     Average    Variance
                                           Alpha                        Reliability   Extracted (AVE)
                  FL      0.739            0.871            0.874       0.903         0.608
                  SA      0.783            0.881            0.883       0.913         0.678
                  PP      0.814            0.764            0.764       0.864         0.679
                  MA      0.708            0.852            0.856       0.890         0.575
                  BU      0.725            0.876            0.878       0.906         0.618
                  SI      0.715            0.874            0.876       0.905         0.614
                                                                                            Source: Author
                        The measurement model was first evaluated by examining indicator reliability. All
                  outer loadings exceeded the recommended threshold of 0.708, indicating that the
                  observed indicators adequately represent their respective latent constructs (Vinzi et al.,
                  2010; Hair et al., 2019). Internal consistency reliability was assessed using Cronbach’s
                  Alpha and Composite Reliability (CR). All constructs (FL, SA, PP, MA, BU, and SI)
                  demonstrated satisfactory reliability, with both Cronbach’s Alpha and CR values
                  exceeding 0.70. Composite Reliability values ranged from 0.864 to 0.913, indicating strong
                  internal consistency without evidence of redundancy (Nunnally & Bernstein, 1994). The

                                                                                                      540