
Page 468 - ISC PROCEEDINGS 21.4
P. 468
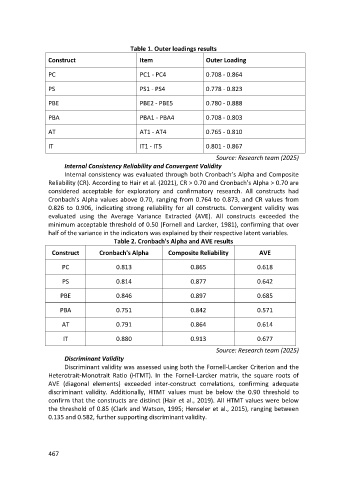
Table 1. Outer loadings results
                  Construct                       Item                   Outer Loading

                  PC                              PC1 - PC4              0.708 - 0.864

                  PS                              PS1 - PS4              0.778 - 0.823


                  PBE                             PBE2 - PBE5            0.780 - 0.888

                  PBA                             PBA1 - PBA4            0.708 - 0.803

                  AT                              AT1 - AT4              0.765 - 0.810

                  IT                              IT1 - IT5              0.801 - 0.867

                                                                             Source: Research team (2025)
                        Internal Consistency Reliability and Convergent Validity
                        Internal consistency was evaluated through both Cronbach’s Alpha and Composite
                  Reliability (CR). According to Hair et al. (2021), CR > 0.70 and Cronbach’s Alpha > 0.70 are
                  considered acceptable for exploratory and confirmatory research. All constructs had
                  Cronbach’s Alpha values above 0.70, ranging from 0.764 to 0.873, and CR values from
                  0.826 to 0.906, indicating strong reliability for all constructs. Convergent validity was
                  evaluated using the Average Variance Extracted (AVE). All constructs exceeded the
                  minimum acceptable threshold of 0.50 (Fornell and Larcker, 1981), confirming that over
                  half of the variance in the indicators was explained by their respective latent variables.
                                         Table 2. Cronbach's Alpha and AVE results
                   Construct        Cronbach's Alpha        Composite Reliability           AVE


                       PC                 0.813                     0.865                  0.618

                       PS                 0.814                     0.877                  0.642

                      PBE                 0.846                     0.897                  0.685

                      PBA                 0.751                     0.842                  0.571

                       AT                 0.791                     0.864                  0.614

                       IT                 0.880                     0.913                  0.677

                                                                             Source: Research team (2025)
                        Discriminant Validity
                        Discriminant validity was assessed using both the Fornell-Larcker Criterion and the
                  Heterotrait-Monotrait Ratio (HTMT). In the Fornell-Larcker matrix, the square roots of
                  AVE (diagonal elements) exceeded inter-construct correlations, confirming adequate
                  discriminant validity. Additionally, HTMT values must be below the 0.90 threshold to
                  confirm that the constructs are distinct (Hair et al., 2019). All HTMT values were below
                  the threshold of 0.85 (Clark and Watson, 1995; Henseler et al., 2015), ranging between
                  0.135 and 0.582, further supporting discriminant validity.


                  467