
Page 391 - ISC PROCEEDINGS 21.4
P. 391
explained = 67.70%. For the three moderating variables: KMO = 0.910, Bartlett's test χ² =
1512.449 (p < 0.001), three factors extracted, cumulative variance explained = 71.48%.
For the dependent variable: KMO = 0.790, Bartlett's test χ² = 275.859 (p < 0.001), one
factor extracted, variance explained = 59.92%. All factor loadings exceeded 0.50,
confirming convergent validity and factorial structure.
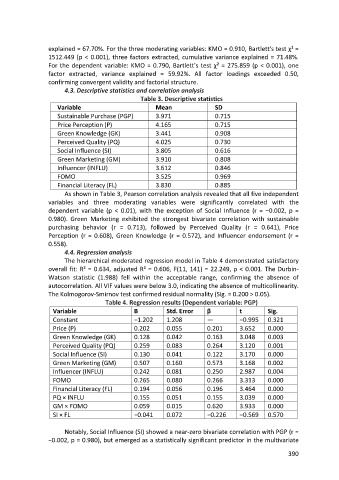
4.3. Descriptive statistics and correlation analysis
Table 3. Descriptive statistics
Variable Mean SD
Sustainable Purchase (PGP) 3.971 0.715
Price Perception (P) 4.165 0.715
Green Knowledge (GK) 3.441 0.908
Perceived Quality (PQ) 4.025 0.730
Social Influence (SI) 3.805 0.616
Green Marketing (GM) 3.910 0.808
Influencer (INFLU) 3.612 0.846
FOMO 3.525 0.969
Financial Literacy (FL) 3.830 0.885
As shown in Table 3, Pearson correlation analysis revealed that all five independent
variables and three moderating variables were significantly correlated with the
dependent variable (p < 0.01), with the exception of Social Influence (r = −0.002, p =
0.980). Green Marketing exhibited the strongest bivariate correlation with sustainable
purchasing behavior (r = 0.713), followed by Perceived Quality (r = 0.641), Price
Perception (r = 0.608), Green Knowledge (r = 0.572), and Influencer endorsement (r =
0.558).
4.4. Regression analysis
The hierarchical moderated regression model in Table 4 demonstrated satisfactory
overall fit: R² = 0.634, adjusted R² = 0.606, F(11, 141) = 22.249, p < 0.001. The Durbin-
Watson statistic (1.988) fell within the acceptable range, confirming the absence of
autocorrelation. All VIF values were below 3.0, indicating the absence of multicollinearity.
The Kolmogorov-Smirnov test confirmed residual normality (Sig. = 0.200 > 0.05).
Table 4. Regression results (Dependent variable: PGP)
Variable B Std. Error β t Sig.
Constant −1.202 1.208 — −0.995 0.321
Price (P) 0.202 0.055 0.201 3.652 0.000
Green Knowledge (GK) 0.128 0.042 0.163 3.048 0.003
Perceived Quality (PQ) 0.259 0.083 0.264 3.120 0.001
Social Influence (SI) 0.130 0.041 0.122 3.170 0.000
Green Marketing (GM) 0.507 0.160 0.573 3.168 0.002
Influencer (INFLU) 0.242 0.081 0.250 2.987 0.004
FOMO 0.265 0.080 0.266 3.313 0.000
Financial Literacy (FL) 0.194 0.056 0.196 3.464 0.000
PQ × INFLU 0.155 0.051 0.155 3.039 0.000
GM × FOMO 0.059 0.015 0.620 3.933 0.000
SI × FL −0.041 0.072 −0.226 −0.569 0.570
Notably, Social Influence (SI) showed a near-zero bivariate correlation with PGP (r =
−0.002, p = 0.980), but emerged as a statistically significant predictor in the multivariate
390