
Page 302 - ISC PROCEEDINGS 21.4
P. 302
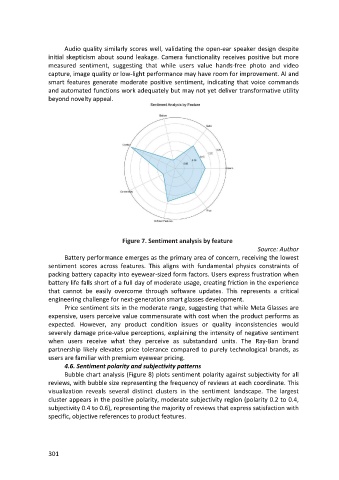
Audio quality similarly scores well, validating the open-ear speaker design despite
                  initial skepticism about sound leakage. Camera functionality receives positive but more
                  measured sentiment, suggesting that while users value hands-free photo and video
                  capture, image quality or low-light performance may have room for improvement. AI and
                  smart features generate moderate positive sentiment, indicating that voice commands
                  and automated functions work adequately but may not yet deliver transformative utility
                  beyond novelty appeal.


                                            Figure 7. Sentiment analysis by feature
                                                                                            Source: Author
                        Battery performance emerges as the primary area of concern, receiving the lowest
                  sentiment scores across features. This aligns with fundamental physics constraints of
                  packing battery capacity into eyewear-sized form factors. Users express frustration when
                  battery life falls short of a full day of moderate usage, creating friction in the experience
                  that cannot be easily overcome through software updates. This represents a critical
                  engineering challenge for next-generation smart glasses development.
                        Price sentiment sits in the moderate range, suggesting that while Meta Glasses are
                  expensive, users perceive value commensurate with cost when the product performs as
                  expected. However, any product condition issues or quality inconsistencies would
                  severely damage price-value perceptions, explaining the intensity of negative sentiment
                  when users receive what they perceive as substandard units. The Ray-Ban brand
                  partnership likely elevates price tolerance compared to purely technological brands, as
                  users are familiar with premium eyewear pricing.
                        4.6. Sentiment polarity and subjectivity patterns
                        Bubble chart analysis (Figure 8) plots sentiment polarity against subjectivity for all
                  reviews, with bubble size representing the frequency of reviews at each coordinate. This
                  visualization reveals several distinct clusters in the sentiment landscape. The largest
                  cluster appears in the positive polarity, moderate subjectivity region (polarity 0.2 to 0.4,
                  subjectivity 0.4 to 0.6), representing the majority of reviews that express satisfaction with
                  specific, objective references to product features.


                  301