
Page 298 - ISC PROCEEDINGS 21.4
P. 298
segments containing these terms. This approach enables granular understanding of
satisfaction drivers across multiple product dimensions.
4. Results and discussion
4.1. Overall sentiment distribution
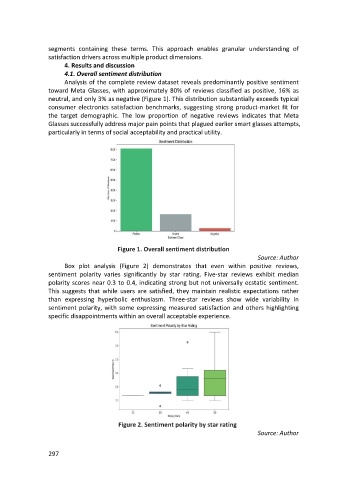
Analysis of the complete review dataset reveals predominantly positive sentiment
toward Meta Glasses, with approximately 80% of reviews classified as positive, 16% as
neutral, and only 3% as negative (Figure 1). This distribution substantially exceeds typical
consumer electronics satisfaction benchmarks, suggesting strong product-market fit for
the target demographic. The low proportion of negative reviews indicates that Meta
Glasses successfully address major pain points that plagued earlier smart glasses attempts,
particularly in terms of social acceptability and practical utility.
Figure 1. Overall sentiment distribution
Source: Author
Box plot analysis (Figure 2) demonstrates that even within positive reviews,
sentiment polarity varies significantly by star rating. Five-star reviews exhibit median
polarity scores near 0.3 to 0.4, indicating strong but not universally ecstatic sentiment.
This suggests that while users are satisfied, they maintain realistic expectations rather
than expressing hyperbolic enthusiasm. Three-star reviews show wide variability in
sentiment polarity, with some expressing measured satisfaction and others highlighting
specific disappointments within an overall acceptable experience.
Figure 2. Sentiment polarity by star rating
Source: Author
297