
Page 166 - ISC PROCEEDINGS 21.4
P. 166
increases. This youthful composition is further reflected in the educational profiles, where
bachelor’s degree holders form the largest segment (58.6%), followed by those with a
high school education (30.6%), while other educational levels represent a negligible
portion of the sample. Geographically, the participants are predominantly concentrated
in Hanoi, followed by Ho Chi Minh City and various other provinces.
In terms of socioeconomic characteristics, a significant majority of respondents,
64.5%, report a monthly income of less than 5 million VND. The survey also captured the
digital engagement of these users, revealing that 75.3% of participants maintain between
one and three accounts on live-streaming shopping platforms. This high level of platform
adoption is reflective of the current Vietnamese e-commerce landscape, where Shopee
and TikTok Shop serve as the primary venues for live-streaming commerce. Consequently,
the dataset offers a representative snapshot of the most active consumer segment within
Vietnam’s burgeoning digital retail market. Furthermore, in this survey, the items
designed to collect data on viewers' perceptions, perceived justice, and resistance
intentions utilized a 5-point Likert scale, ranging from 1 “Strongly Disagree” to 5 “Strongly
Agree”.
3.2. Measurement Model Assessment
To ensure the quality of the measurement model, we conducted a series of
evaluations following the guidelines proposed by Hair et al. (2021), including indicator
reliability, internal consistency reliability, convergent validity, and discriminant validity.
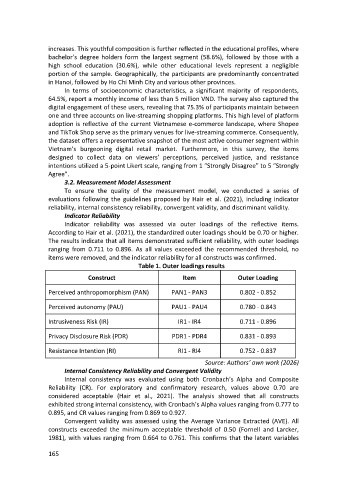
Indicator Reliability
Indicator reliability was assessed via outer loadings of the reflective items.
According to Hair et al. (2021), the standardized outer loadings should be 0.70 or higher.
The results indicate that all items demonstrated sufficient reliability, with outer loadings
ranging from 0.711 to 0.896. As all values exceeded the recommended threshold, no
items were removed, and the indicator reliability for all constructs was confirmed.
Table 1. Outer loadings results
Construct Item Outer Loading
Perceived anthropomorphism (PAN) PAN1 - PAN3 0.802 - 0.852
Perceived autonomy (PAU) PAU1 - PAU4 0.780 - 0.843
Intrusiveness Risk (IR) IR1 - IR4 0.711 - 0.896
Privacy Disclosure Risk (PDR) PDR1 - PDR4 0.831 - 0.893
Resistance Intention (RI) RI1 - RI4 0.752 - 0.837
Source: Authors’ own work (2026)
Internal Consistency Reliability and Convergent Validity
Internal consistency was evaluated using both Cronbach’s Alpha and Composite
Reliability (CR). For exploratory and confirmatory research, values above 0.70 are
considered acceptable (Hair et al., 2021). The analysis showed that all constructs
exhibited strong internal consistency, with Cronbach’s Alpha values ranging from 0.777 to
0.895, and CR values ranging from 0.869 to 0.927.
Convergent validity was assessed using the Average Variance Extracted (AVE). All
constructs exceeded the minimum acceptable threshold of 0.50 (Fornell and Larcker,
1981), with values ranging from 0.664 to 0.761. This confirms that the latent variables
165