Page 167 - ISC PROCEEDINGS 21.4
P. 167

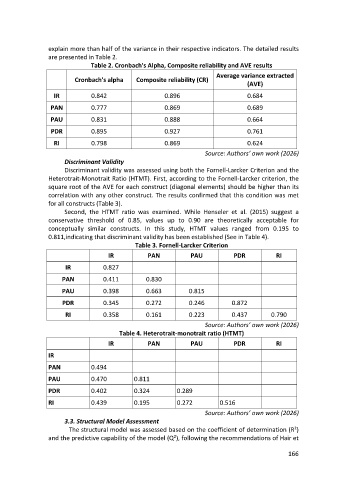
explain more than half of the variance in their respective indicators. The detailed results
                  are presented in Table 2.
                                 Table 2. Cronbach's Alpha, Composite reliability and AVE results

                                                                             Average variance extracted
                           Cronbach's alpha      Composite reliability (CR)
                                                                                        (AVE)
                    IR           0.842                     0.896                        0.684
                   PAN           0.777                     0.869                        0.689

                   PAU           0.831                     0.888                        0.664

                   PDR           0.895                     0.927                        0.761
                    RI           0.798                     0.869                        0.624
                                                                         Source: Authors’ own work (2026)
                        Discriminant Validity
                        Discriminant validity was assessed using both the Fornell-Larcker Criterion and the
                  Heterotrait-Monotrait Ratio (HTMT). First, according to the Fornell-Larcker criterion, the
                  square root of the AVE for each construct (diagonal elements) should be higher than its
                  correlation with any other construct. The results confirmed that this condition was met
                  for all constructs (Table 3).
                        Second, the HTMT ratio was examined. While Henseler et al. (2015) suggest a
                  conservative threshold of 0.85, values up to 0.90 are theoretically acceptable for
                  conceptually similar constructs. In this study, HTMT values ranged from 0.195 to
                  0.811,indicating that discriminant validity has been established (See in Table 4).
                                                Table 3. Fornell-Larcker Criterion
                                       IR            PAN            PAU            PDR            RI

                        IR           0.827
                       PAN           0.411          0.830

                       PAU           0.398          0.663          0.815
                       PDR           0.345          0.272          0.246          0.872

                        RI           0.358          0.161          0.223          0.437         0.790
                                                                         Source: Authors’ own work (2026)
                                           Table 4. Heterotrait-monotrait ratio (HTMT)
                                       IR            PAN            PAU            PDR            RI

                  IR
                  PAN            0.494

                  PAU            0.470          0.811

                  PDR            0.402          0.324          0.289
                  RI             0.439          0.195          0.272          0.516

                                                                         Source: Authors’ own work (2026)
                        3.3. Structural Model Assessment
                         The structural model was assessed based on the coefficient of determination (R²)
                  and the predictive capability of the model (Q²), following the recommendations of Hair et

                                                                                                      166
   162   163   164   165   166   167   168   169   170   171   172