
Page 168 - ISC PROCEEDINGS 21.4
P. 168
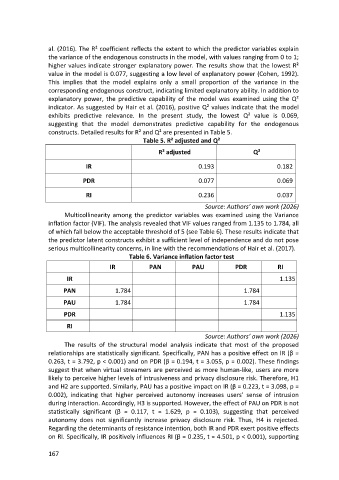
al. (2016). The R² coefficient reflects the extent to which the predictor variables explain
                  the variance of the endogenous constructs in the model, with values ranging from 0 to 1;
                  higher values indicate stronger explanatory power. The results show that the lowest R²
                  value in the model is 0.077, suggesting a low level of explanatory power (Cohen, 1992).
                  This implies that the model explains only a small proportion of the variance in the
                  corresponding endogenous construct, indicating limited explanatory ability. In addition to
                  explanatory power, the predictive capability of the model was examined using the Q²
                  indicator. As suggested by Hair et al. (2016), positive Q² values indicate that the model
                  exhibits predictive relevance. In the present study, the lowest Q² value is 0.069,
                  suggesting that the model demonstrates predictive capability for the endogenous
                  constructs. Detailed results for R² and Q² are presented in Table 5.
                                                   Table 5. R² adjusted and Q²
                                                         R² adjusted                      Q²

                               IR                                      0.193                      0.182

                              PDR                                      0.077                      0.069


                               RI                                      0.236                      0.037
                                                                         Source: Authors’ own work (2026)
                        Multicollinearity among the predictor variables was examined using the Variance
                  inflation factor (VIF). The analysis revealed that VIF values ranged from 1.135 to 1.784, all
                  of which fall below the acceptable threshold of 5 (see Table 6). These results indicate that
                  the predictor latent constructs exhibit a sufficient level of independence and do not pose
                  serious multicollinearity concerns, in line with the recommendations of Hair et al. (2017).
                                              Table 6. Variance inflation factor test
                                        IR           PAN            PAU             PDR            RI

                         IR                                                                        1.135

                       PAN                1.784                                        1.784
                       PAU                1.784                                        1.784

                       PDR                                                                         1.135
                         RI

                                                                         Source: Authors’ own work (2026)
                        The results of the structural model analysis indicate that most of the proposed
                  relationships are statistically significant. Specifically, PAN has a positive effect on IR (β =
                  0.263, t = 3.792, p < 0.001) and on PDR (β = 0.194, t = 3.055, p = 0.002). These findings
                  suggest that when virtual streamers are perceived as more human-like, users are more
                  likely to perceive higher levels of intrusiveness and privacy disclosure risk. Therefore, H1
                  and H2 are supported. Similarly, PAU has a positive impact on IR (β = 0.223, t = 3.098, p =
                  0.002), indicating that higher perceived autonomy increases users’ sense of intrusion
                  during interaction. Accordingly, H3 is supported. However, the effect of PAU on PDR is not
                  statistically significant (β = 0.117, t = 1.629, p = 0.103), suggesting that perceived
                  autonomy does not significantly increase privacy disclosure risk. Thus, H4 is rejected.
                  Regarding the determinants of resistance intention, both IR and PDR exert positive effects
                  on RI. Specifically, IR positively influences RI (β = 0.235, t = 4.501, p < 0.001), supporting

                  167