
Page 174 - Demo
P. 174
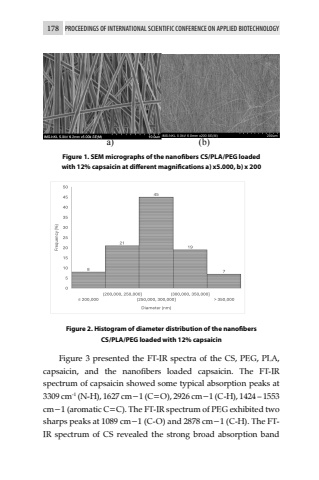
178 PROCEEDINGS OF INTERNATIONAL SCIENTIFIC CONFERENCE ON APPLIED BIOTECHNOLOGYa) (b)Figure 1. SEM micrographs of the nanofibers CS/PLA/PEG loaded with 12% capsaicin at different magnifications a) x5.000, b) x 200Figure 2. Histogram of diameter distribution of the nanofibers CS/PLA/PEG loaded with 12% capsaicinFigure 3 presented the FT-IR spectra of the CS, PEG, PLA, capsaicin, and the nanofibers loaded capsaicin. The FT-IR spectrum of capsaicin showed some typical absorption peaks at 3309 cm-1 (N-H), 1627 cm%u22121 (C=O), 2926 cm%u22121 (C-H), 1424 %u2013 1553 cm%u22121 (aromatic C=C). The FT-IR spectrum of PEG exhibited two sharps peaks at 1089 cm%u22121 (C-O) and 2878 cm%u22121 (C-H). The FTIR spectrum of CS revealed the strong broad absorption band
