
Page 563 - Ebook HTKH 2024
P. 563
its observed variables. That MSV = 0.73 < AVE shows a suitable discriminant value,
the observed variable does not have a high correlation with other observed variables
located in other constructs, that is, latent variables are not better explained by observed
variables (of other factors) than the observed variables themselves.
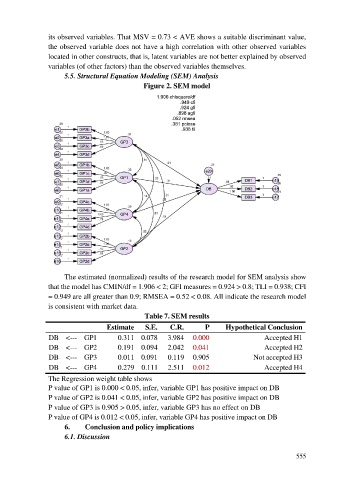
5.5. Structural Equation Modeling (SEM) Analysis
Figure 2. SEM model
The estimated (normalized) results of the research model for SEM analysis show
that the model has CMIN/df = 1.906 < 2; GFI measures = 0.924 > 0.8; TLI = 0.938; CFI
= 0.949 are all greater than 0.9; RMSEA = 0.52 < 0.08. All indicate the research model
is consistent with market data.
Table 7. SEM results
Estimate S.E. C.R. P Hypothetical Conclusion
DB <--- GP1 0.311 0.078 3.984 0.000 Accepted H1
DB <--- GP2 0.191 0.094 2.042 0.041 Accepted H2
DB <--- GP3 0.011 0.091 0.119 0.905 Not accepted H3
DB <--- GP4 0.279 0.111 2.511 0.012 Accepted H4
The Regression weight table shows
P value of GP1 is 0.000 < 0.05, infer, variable GP1 has positive impact on DB
P value of GP2 is 0.041 < 0.05, infer, variable GP2 has positive impact on DB
P value of GP3 is 0.905 > 0.05, infer, variable GP3 has no effect on DB
P value of GP4 is 0.012 < 0.05, infer, variable GP4 has positive impact on DB
6. Conclusion and policy implications
6.1. Discussion
555