Page 562 - Ebook HTKH 2024
P. 562

value: Chi-square = 270.67, degrees of freedom = 142, P value = 0.000. According to
                  Hair et al. (2010), Multivariate Data Analysis, 7th edition, CMIN/df = 1,450 ≤ 2 is good;

                  CFI = 0.949 ≥ 0.9 is good; GFI = 0.924 ≥ 0.9 is good; RMSEA = 0.052 ≤ 0.08 shows
                  that  the  model  is  consistent  with  market  data.  The  above  results  confirm  the
                  unidimensionality  of  the  scales  of  product,  price,  promotion,  place  and  purchase
                  decision.
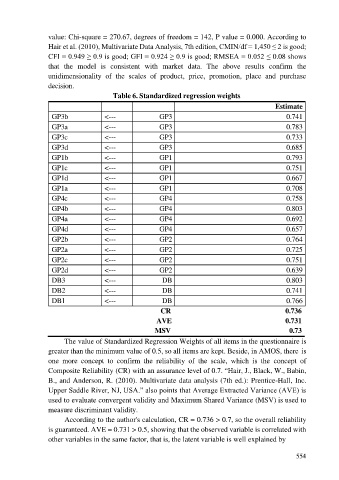
                                         Table 6. Standardized regression weights
                                                                                                  Estimate

                   GP3b               <---               GP3                                          0.741
                   GP3a               <---               GP3                                          0.783
                   GP3c               <---               GP3                                          0.733
                   GP3d               <---               GP3                                          0.685

                   GP1b               <---               GP1                                          0.793
                   GP1c               <---               GP1                                          0.751
                   GP1d               <---               GP1                                          0.667
                   GP1a               <---               GP1                                          0.708
                   GP4c               <---               GP4                                          0.758

                   GP4b               <---               GP4                                          0.803
                   GP4a               <---               GP4                                          0.692
                   GP4d               <---               GP4                                          0.657

                   GP2b               <---               GP2                                          0.764
                   GP2a               <---               GP2                                          0.725
                   GP2c               <---               GP2                                          0.751
                   GP2d               <---               GP2                                          0.639
                   DB3                <---                DB                                          0.803

                   DB2                <---                DB                                          0.741
                   DB1                <---                DB                                          0.766
                                                         CR                                          0.736
                                                        AVE                                          0.731

                                                       MSV                                             0.73
                        The value of Standardized Regression Weights of all items in the questionnaire is
                  greater than the minimum value of 0.5, so all items are kept. Beside, in AMOS, there is
                  one  more  concept  to  confirm  the  reliability  of  the  scale,  which  is  the  concept  of
                  Composite Reliability (CR) with an assurance level of 0.7. “Hair, J., Black, W., Babin,
                  B., and Anderson, R. (2010). Multivariate data analysis (7th ed.): Prentice-Hall, Inc.

                  Upper Saddle River, NJ, USA.” also points that Average Extracted Variance (AVE) is
                  used to evaluate convergent validity and Maximum Shared Variance (MSV) is used to
                  measure discriminant validity.
                        According to the author's calculation, CR = 0.736 > 0.7, so the overall reliability
                  is guaranteed. AVE = 0.731 > 0.5, showing that the observed variable is correlated with
                  other variables in the same factor, that is, the latent variable is well explained by


                                                                                                         554
   557   558   559   560   561   562   563   564   565   566   567