
Page 560 - Ebook HTKH 2024
P. 560
respondents are officials and staff working in state-owned enterprises with the
proportion of 30.4%, followed by employees in private organizations.
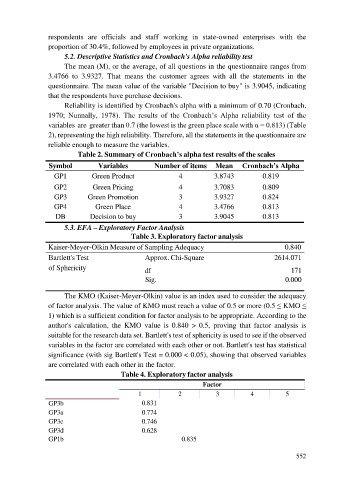
5.2. Descriptive Statistics and Cronbach's Alpha reliability test
The mean (M), or the average, of all questions in the questionnaire ranges from
3.4766 to 3.9327. That means the customer agrees with all the statements in the
questionnaire. The mean value of the variable "Decision to buy" is 3.9045, indicating
that the respondents have purchase decisions.
Reliability is identified by Cronbach's alpha with a minimum of 0.70 (Cronbach,
1970; Nunnally, 1978). The results of the Cronbach’s Alpha reliability test of the
variables are greater than 0.7 (the lowest is the green place scale with α = 0.813) (Table
2), representing the high reliability. Therefore, all the statements in the questionnaire are
reliable enough to measure the variables.
Table 2. Summary of Cronbach’s alpha test results of the scales
Symbol Variables Number of items Mean Cronbach’s Alpha
GP1 Green Product 4 3.8743 0.819
GP2 Green Pricing 4 3.7083 0.809
GP3 Green Promotion 3 3.9327 0.824
GP4 Green Place 4 3.4766 0.813
DB Decision to buy 3 3.9045 0.813
5.3. EFA – Exploratory Factor Analysis
Table 3. Exploratory factor analysis
Kaiser-Meyer-Olkin Measure of Sampling Adequacy 0.840
Bartlett's Test Approx. Chi-Square 2614.071
of Sphericity df 171
Sig. 0.000
The KMO (Kaiser-Meyer-Olkin) value is an index used to consider the adequacy
of factor analysis. The value of KMO must reach a value of 0.5 or more (0.5 ≤ KMO ≤
1) which is a sufficient condition for factor analysis to be appropriate. According to the
author's calculation, the KMO value is 0.840 > 0.5, proving that factor analysis is
suitable for the research data set. Bartlett's test of sphericity is used to see if the observed
variables in the factor are correlated with each other or not. Bartlett's test has statistical
significance (with sig Bartlett's Test = 0.000 < 0.05), showing that observed variables
are correlated with each other in the factor.
Table 4. Exploratory factor analysis
Factor
1 2 3 4 5
GP3b 0.831
GP3a 0.774
GP3c 0.746
GP3d 0.628
GP1b 0.835
552