Page 264 - Ebook HTKH 2024
P. 264

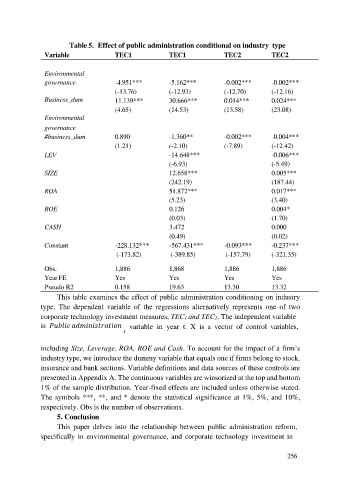
Table 5.  Effect of public administration conditional on industry  type
                 Variable                TEC1               TEC1                TEC2            TEC2

                 Environmental
                 governance              -4.951***          -5.162***           -0.002***       -0.002***
                                         (-13.76)           (-12.93)            (-12.70)        (-12.16)
                 Business_dum            11.139***          30.666***           0.014***        0.024***
                                         (4.65)             (14.53)             (13.58)         (23.08)
                 Environmental
                 governance
                 #business_dum           0.890              -1.360**            -0.002***       -0.004***
                                         (1.21)             (-2.10)             (-7.89)         (-12.42)
                 LEV                                        -14.648***                          -0.006***
                                                            (-6.93)                             (-5.49)
                 SIZE                                       12.658***                           0.005***
                                                            (242.19)                            (187.44)
                 ROA                                        51.872***                           0.017***
                                                            (5.23)                              (3.40)
                 ROE                                         0.126                              0.004*
                                                             (0.03)                             (1.70)
                 CASH                                        3.472                              0.000
                                                             (0.49)                             (0.02)
                 Constant                 -228.132***        -567.431***        -0.093***       -0.237***
                                          (-173.82)          (-389.85)          (-157.79)       (-321.35)

                 Obs.                    1,886               1,868              1,886           1,886
                 Year FE                 Yes                Yes                 Yes             Yes
                 Pseudo R2               0.158              19.63               13.30           13.32
                     This table examines the effect of public administration conditioning on industry
               type.  The  dependent  variable  of  the  regressions  alternatively  represents  one  of  two
               corporate technology investment measures, TEC1 and TEC2. The independent variable

               is                                             variable  in  year  t.  X  is  a  vector  of  control  variables,
                                              

               including Size, Leverage, ROA, ROE and Cash. To account for the impact of a firm’s

               industry type, we introduce the dummy variable that equals one if firms belong to stock,
               insurance and bank sections. Variable definitions and data sources of these controls are
               presented in Appendix A. The continuous variables are winsorized at the top and bottom
               1% of the sample distribution. Year-fixed effects are included unless otherwise stated.
               The symbols ***, **, and * denote the statistical significance at 1%, 5%, and 10%,
               respectively. Obs is the number of observations.
                     5. Conclusion

                     This  paper  delves  into  the  relationship  between  public  administration  reform,
               specifically  in  environmental  governance,  and  corporate  technology  investment  in


                                                                                                      256
   259   260   261   262   263   264   265   266   267   268   269