
Page 259 - Ebook HTKH 2024
P. 259
variables are also in line with previous studies. For instance, Size, Lev, ROA, ROE, and
Cash coefficients are statistically significant and positive, consistent with prior studies
(Yang, Xu and Lai, 2021).
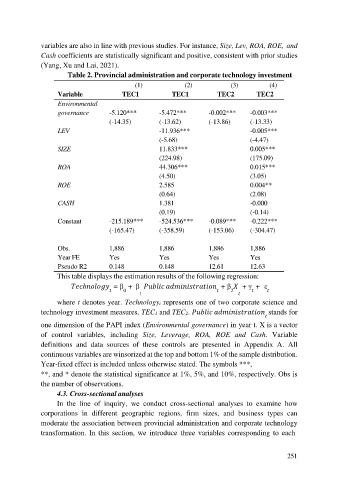
Table 2. Provincial administration and corporate technology investment
(1) (2) (3) (4)
Variable TEC1 TEC1 TEC2 TEC2
Environmental
governance -5.120*** -5.472*** -0.002*** -0.003***
(-14.35) (-13.62) (-13.86) (-13.33)
LEV -11.936*** -0.005***
(-5.68) (-4.47)
SIZE 11.833*** 0.005***
(224.98) (175.09)
ROA 44.306*** 0.015***
(4.50) (3.05)
ROE 2.585 0.004**
(0.64) (2.08)
CASH 1.381 -0.000
(0.19) (-0.14)
Constant -215.189*** -524.536*** -0.089*** -0.222***
(-165.47) (-358.59) (-153.06) (-304.47)
Obs. 1,886 1,886 1,886 1,886
Year FE Yes Yes Yes Yes
Pseudo R2 0.148 0.148 12.61 12.63
This table displays the estimation results of the following regression:
ℎ = β + β + β + γ + ε
0 2
1
where t denotes year. Technologyt represents one of two corporate science and
technology investment measures, TEC1 and TEC2. stands for
one dimension of the PAPI index (Environmental governance) in year t. X is a vector
of control variables, including Size, Leverage, ROA, ROE and Cash. Variable
definitions and data sources of these controls are presented in Appendix A. All
continuous variables are winsorized at the top and bottom 1% of the sample distribution.
Year-fixed effect is included unless otherwise stated. The symbols ***,
**, and * denote the statistical significance at 1%, 5%, and 10%, respectively. Obs is
the number of observations.
4.3. Cross-sectional analyses
In the line of inquiry, we conduct cross-sectional analyses to examine how
corporations in different geographic regions, firm sizes, and business types can
moderate the association between provincial administration and corporate technology
transformation. In this section, we introduce three variables corresponding to each
251