
Page 257 - Ebook HTKH 2024
P. 257
(2) TEC2 is defined as the amount of STD funds divided by the firm’s sales
revenue.
Since only a small number of companies have established STD funds, we found
that 32 out of 523 companies contributed to the STD fund, representing 10% of the total.
To address the impact of numerous zero values, we employ a Tobit model in our
regression analysis.
3.3. Control variables
We include a host of firm-specific attributes that are good predictors of firm
technologization based on prior literature (Gan and Xu, 2019; Tong et al., 2018; Yang,
Xu, and Lai, 2021). At the firm level, we control for the following variables: (1) Size is
the natural logarithm of a firm’s market value, (2) Leverage is the ratio of long‐term
debt over total assets, (3) Cash is the ratio of cash over total assets, (4) ROA is the ratio
of net income over total assets, (5) ROE is the ratio of net income over shareholder’s
%
equity. We will normize all continuous variables at 1 and 99% levels. The descriptive
statistics of these firm-level control variables are presented in Panel A of Table 1.
4. Empirical results
4.1. Descriptive statistics
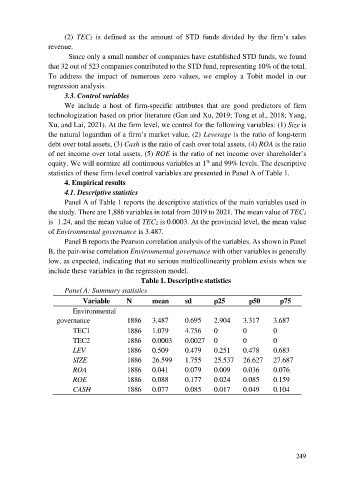
Panel A of Table 1 reports the descriptive statistics of the main variables used in
the study. There are 1,886 variables in total from 2019 to 2021. The mean value of TEC1
is 1.24, and the mean value of TEC2 is 0.0003. At the provincial level, the mean value
of Environmental governance is 3.487.
Panel B reports the Pearson correlation analysis of the variables. As shown in Panel
B, the pair-wise correlation Environmental governance with other variables is generally
low, as expected, indicating that no serious multicollinearity problem exists when we
include these variables in the regression model.
Table 1. Descriptive statistics
Panel A: Summary statistics
Variable N mean sd p25 p50 p75
Environmental
governance 1886 3.487 0.695 2.904 3.317 3.687
TEC1 1886 1.079 4.756 0 0 0
TEC2 1886 0.0003 0.0027 0 0 0
LEV 1886 0.509 0.479 0.251 0.478 0.683
SIZE 1886 26.599 1.755 25.537 26.627 27.687
ROA 1886 0.041 0.079 0.009 0.036 0.076
ROE 1886 0.088 0.177 0.024 0.085 0.159
CASH 1886 0.077 0.085 0.017 0.049 0.104
249